Portfolio
I build what other people use to make sense of data: reporting systems, interactive applications, and analyses that turn large environmental datasets into something a non-specialist can read and act on. Mostly in R, Python and Quarto, mostly about the ocean.
Email me
Tools and systems
Built for other people to use.
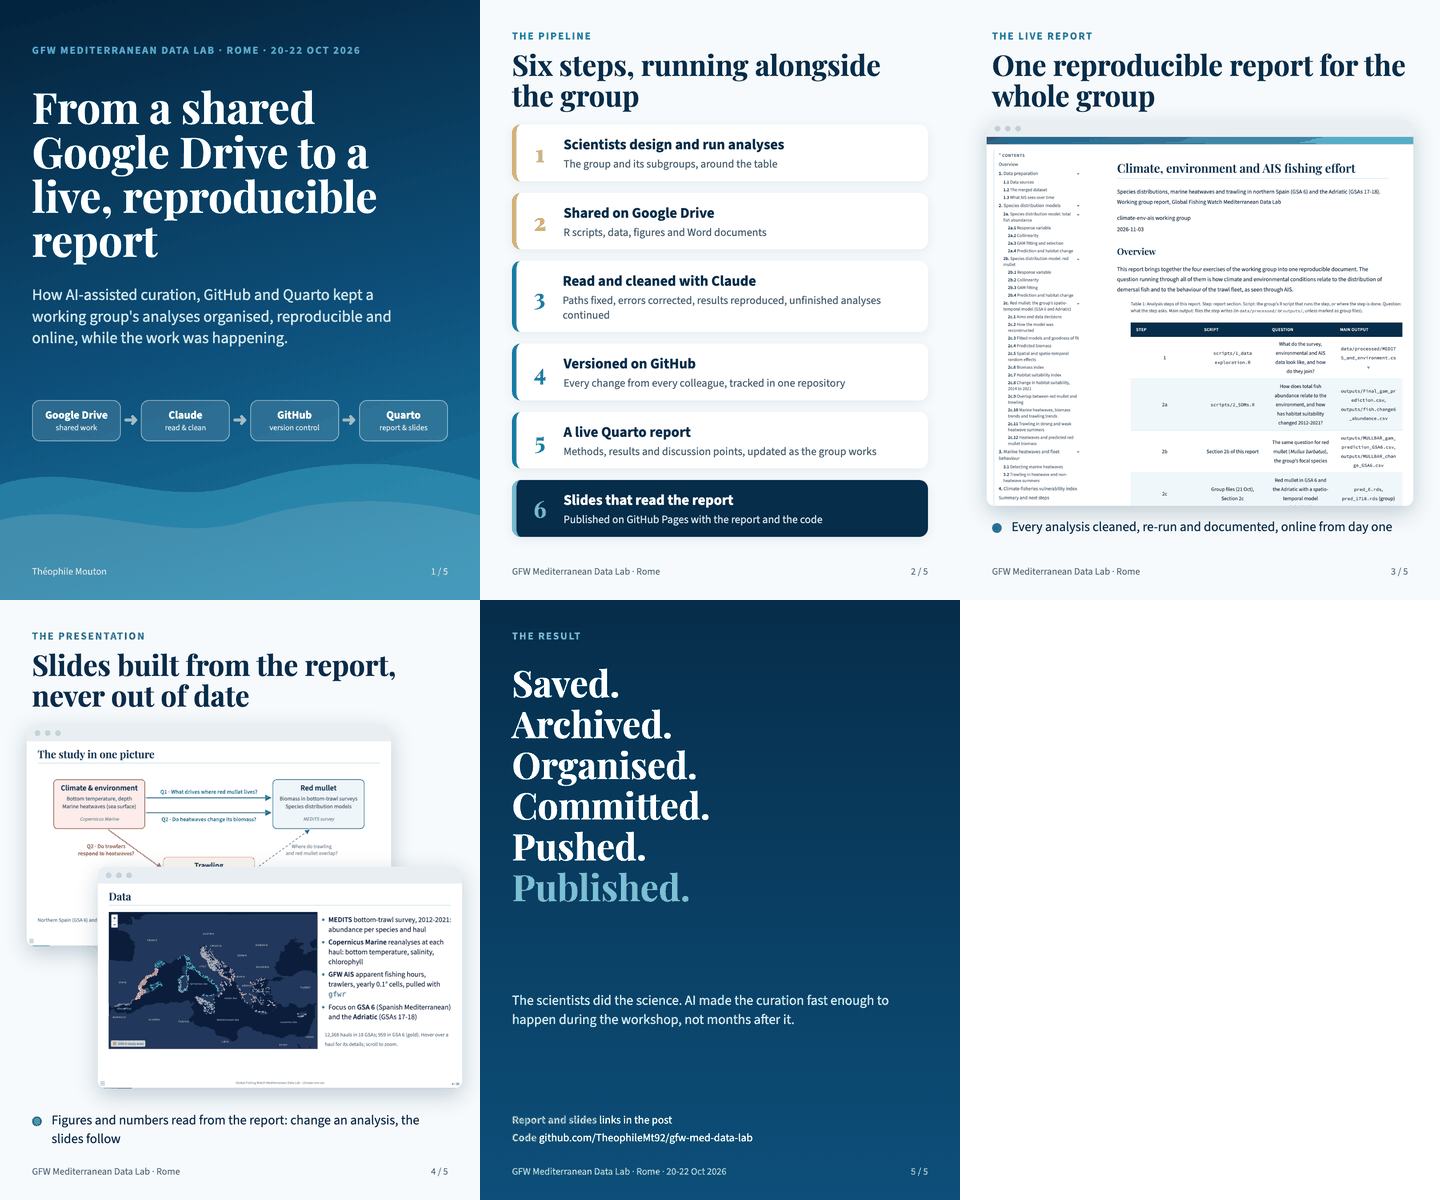
From a shared Drive to a live, reproducible report
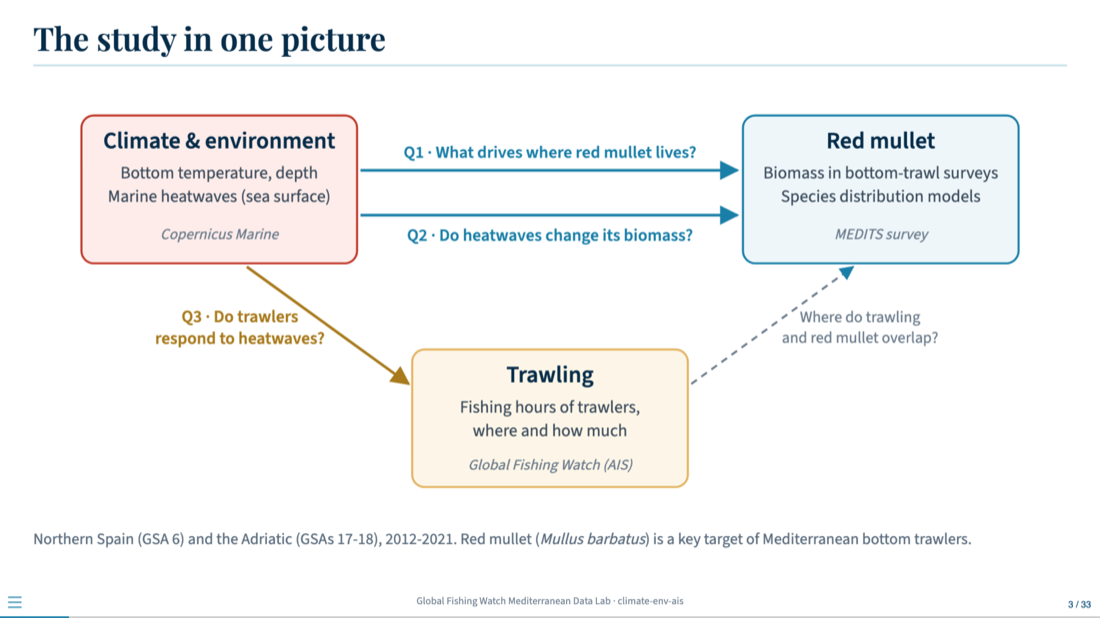
Project leader for a working group of ten scientists linking climate, the marine environment and trawling effort in the Mediterranean. Over three days I coordinated and facilitated the group, shared good practice in reproducible analysis, contributed to the science, and gave the workshop's closing presentation.
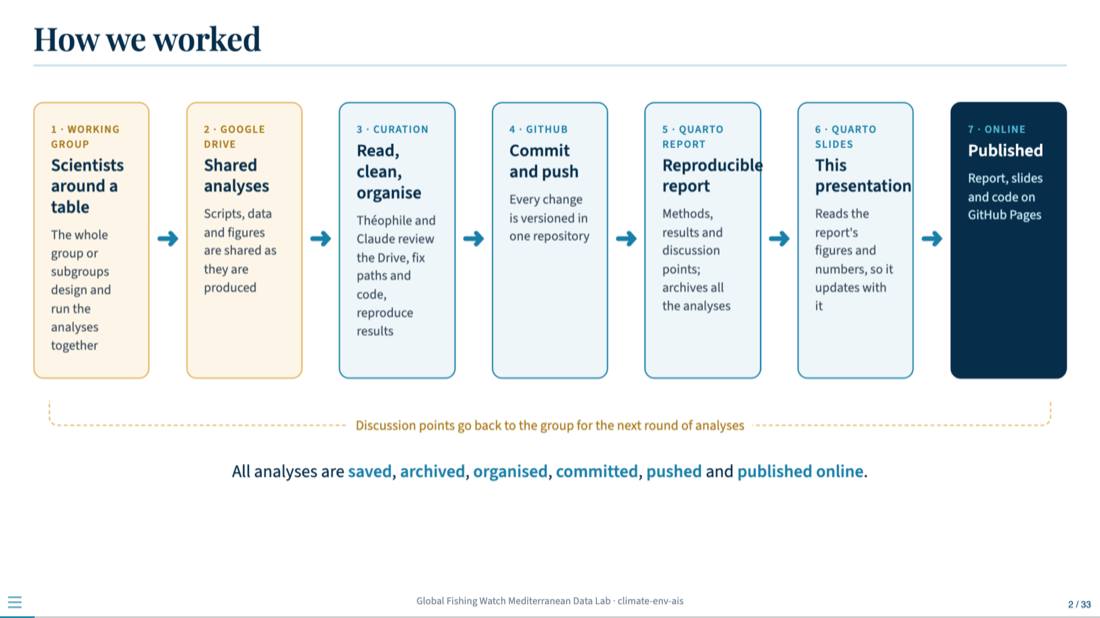
Behind it, a pipeline kept the work organised while it happened: scripts and data curated with AI assistance, every change versioned in one GitHub repository, a live Quarto report the whole group followed, and Quarto slides that updated themselves from it.
Reproducible reporting with Quarto
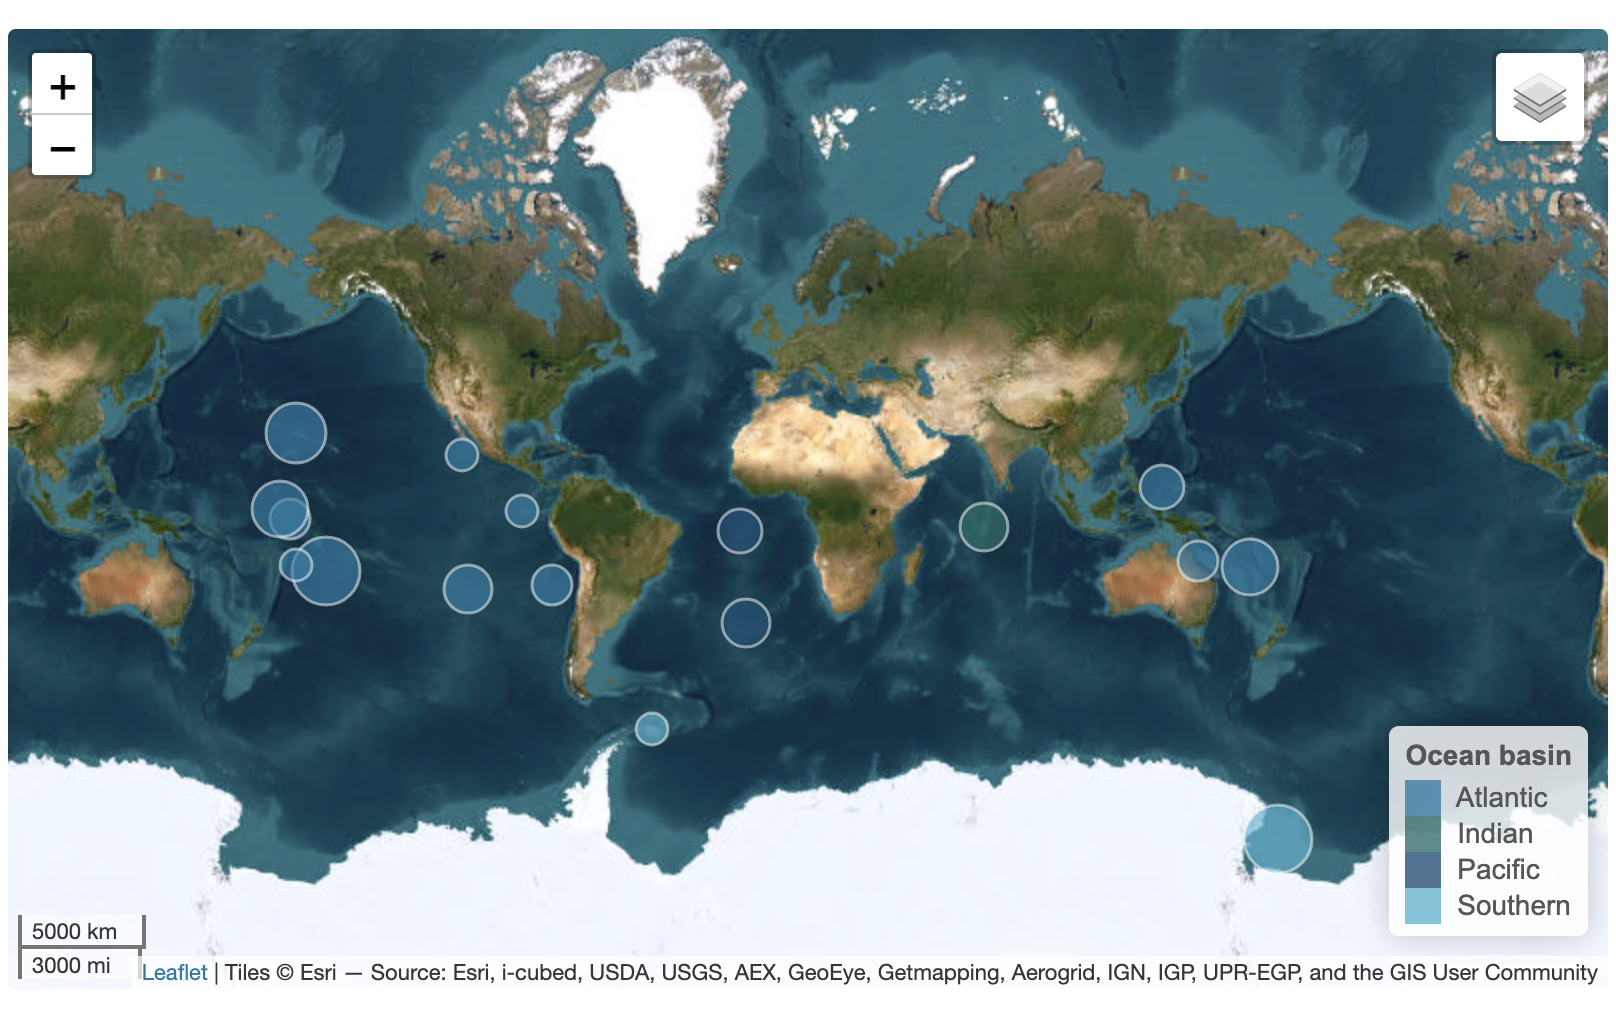
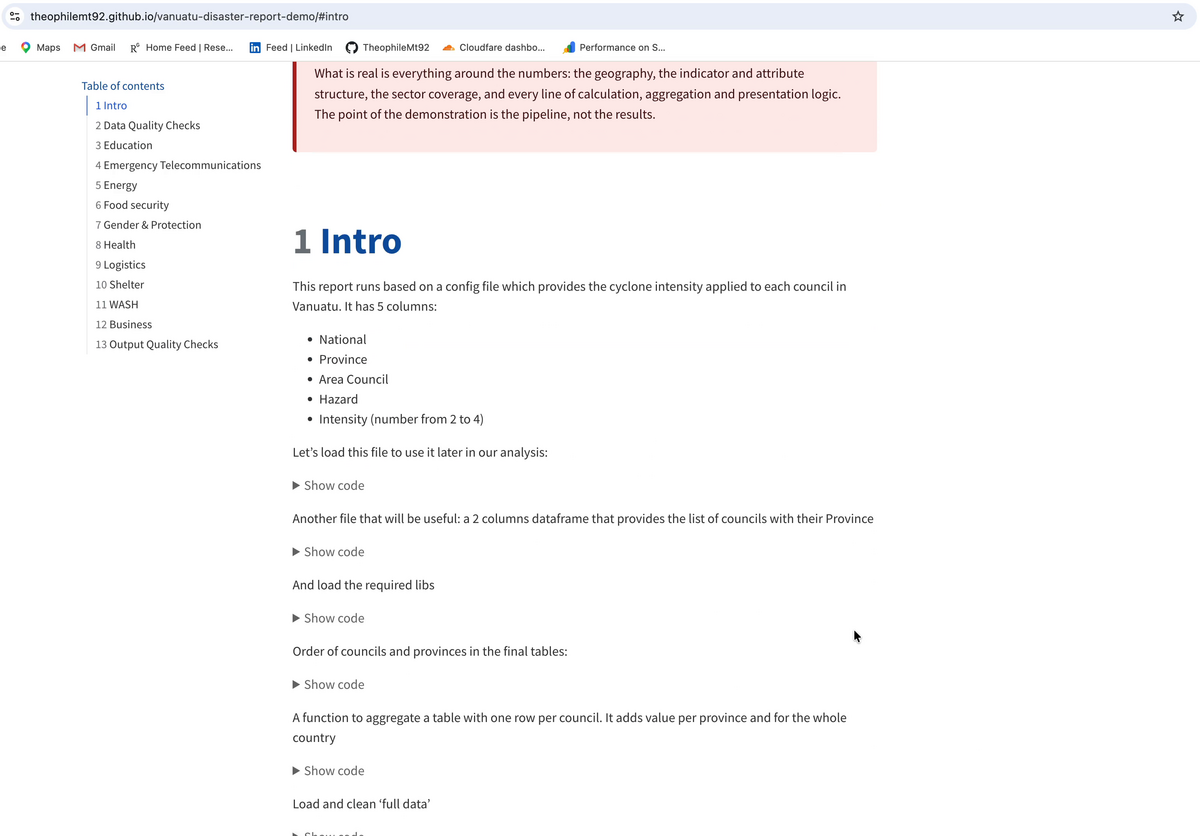
The report template I build for research groups and public agencies. A single .qmd file produces a self-contained HTML report with a custom visual identity, a filterable plotly chart, a leaflet map with switchable basemaps and grouped layers, and a sortable reactable table with in-cell bars. No Bootstrap theme, nothing to install.
Fishing fleet seasonality
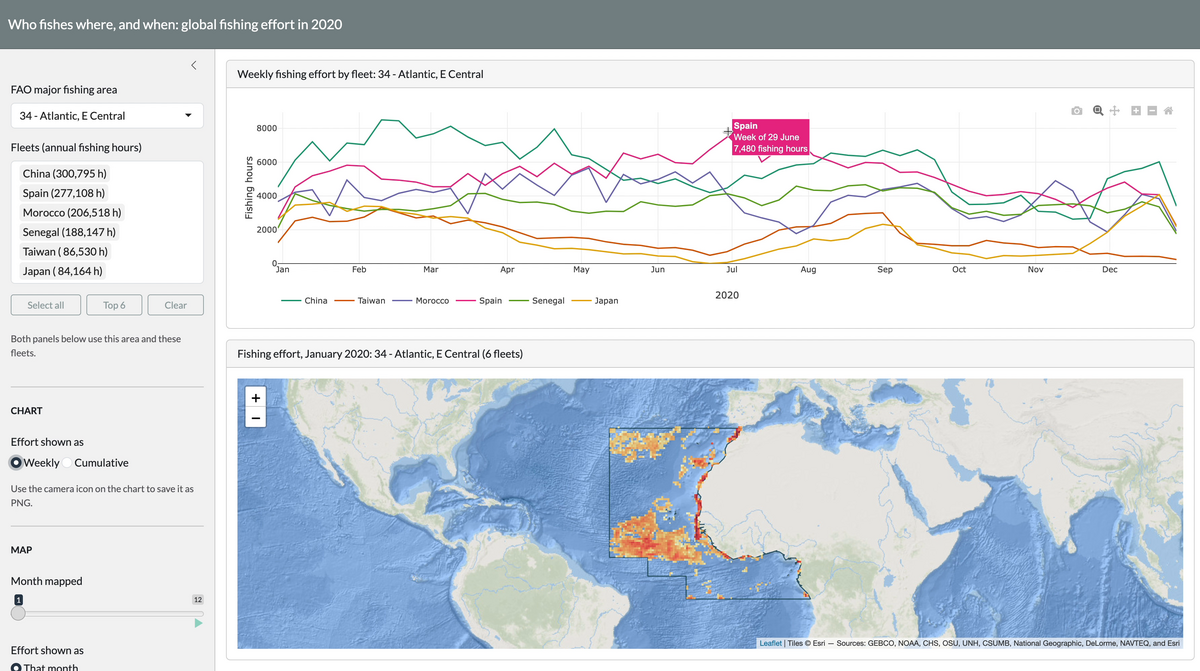
An interactive look at when national fleets fish, and where. Pick an FAO major fishing area and a set of flag states: the chart gives weekly or cumulative fishing hours per fleet across 2020, with the legend ordered by each fleet’s peak week, and the map shows where that effort falls month by month.
FINS Explorer: the fossil record of sharks and rays
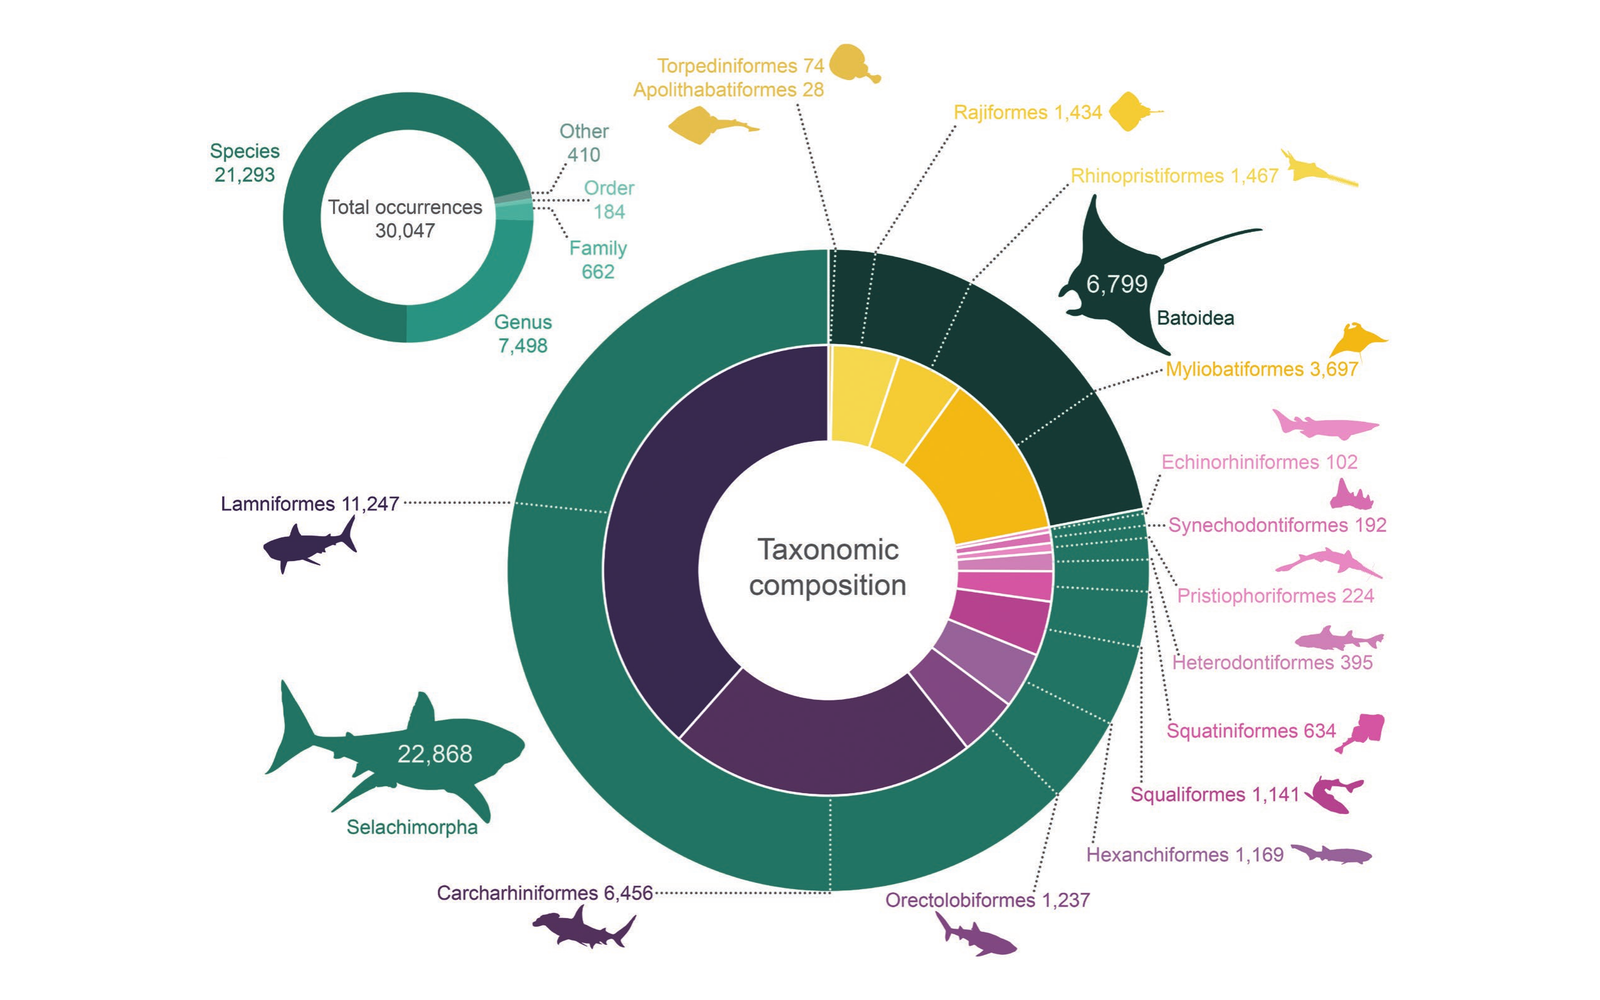
A Shiny application built around the Fossil Neoselachian dataset, a curated global compilation of 30,066 fossil shark, ray and skate occurrences from 5,985 collections and 2,345 publications, spanning the Cretaceous to today. Occurrences, collections and references are browsable as linked tables, filterable by epoch, period, continent, palaeo-ocean and curation status, mapped in present-day or palaeo-coordinates, and extendable: new Paleobiology Database downloads can be uploaded, previewed and appended under the same curation rules. The figure, from the dataset paper, shows its taxonomic composition: occurrences by identification rank, and split between sharks and batoids and across their orders.
DateBack: archaeobotany of the date palm
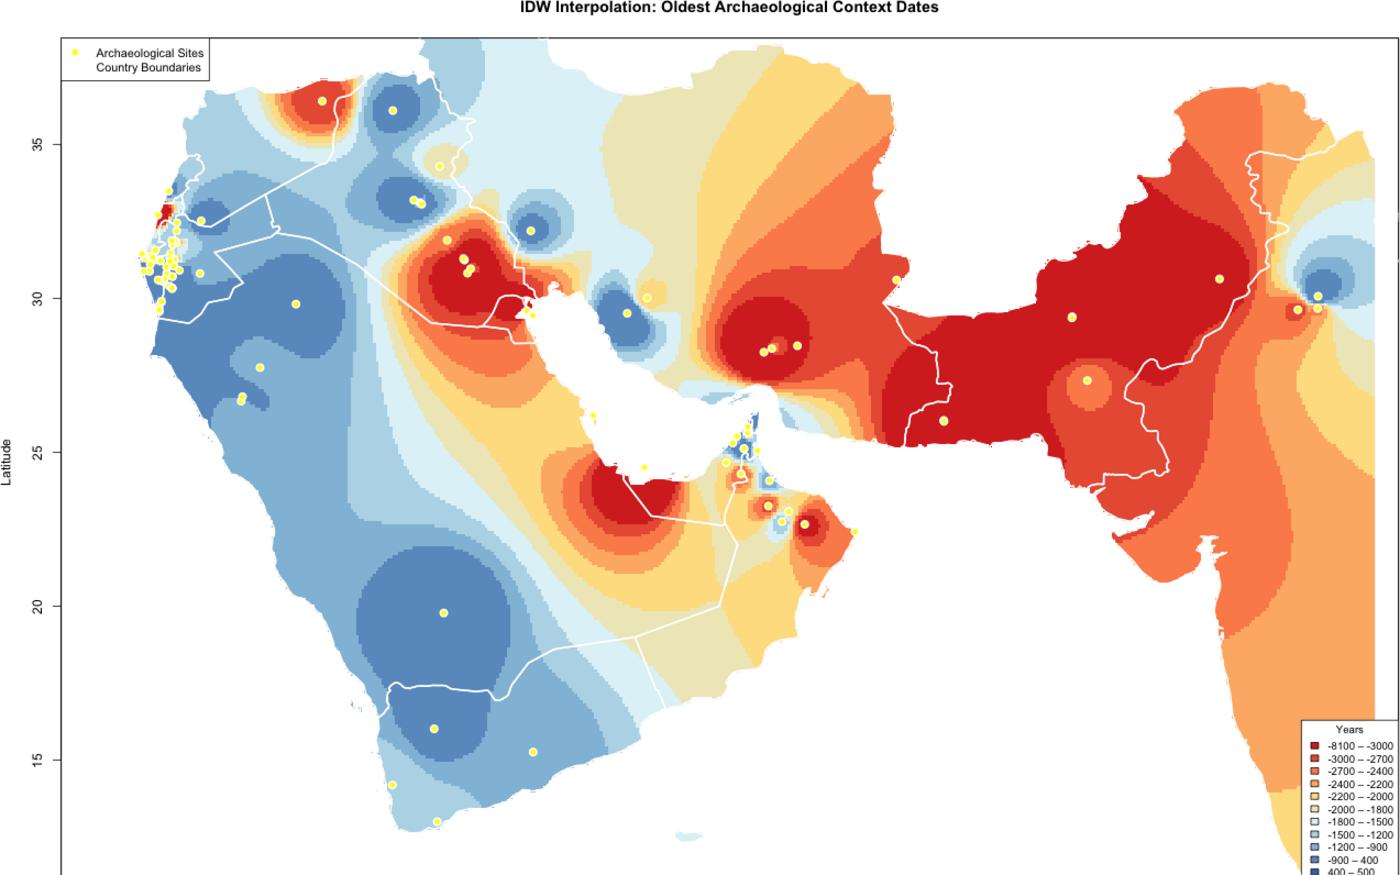
An open platform centralising the archaeobotanical record of the date palm, Phoenix dactylifera, used to trace its domestication and spread across West Asia. My work was on the application: the interactive map and its popups, bins and legends, the data visualisation module and its figure captions, a configuration-driven country and region scheme, aggregation of radiocarbon dates to one median age per context, and the inverse distance weighting interpolation of oldest context dates shown here.

Survey visualisation dashboard
A Shiny application that lets researchers build 14 chart types from Germany’s largest survey on discrimination: bar, stacked bar, circular bar, upset, bubble, dumbbell and Likert. Every chart is configurable from the interface, covering data and layout, labels and text, styles and colours, and chart-specific settings, and exports as a high-resolution PNG or straight to Google Drive, with matching publication-ready data tables.
Data visualisation tutorials
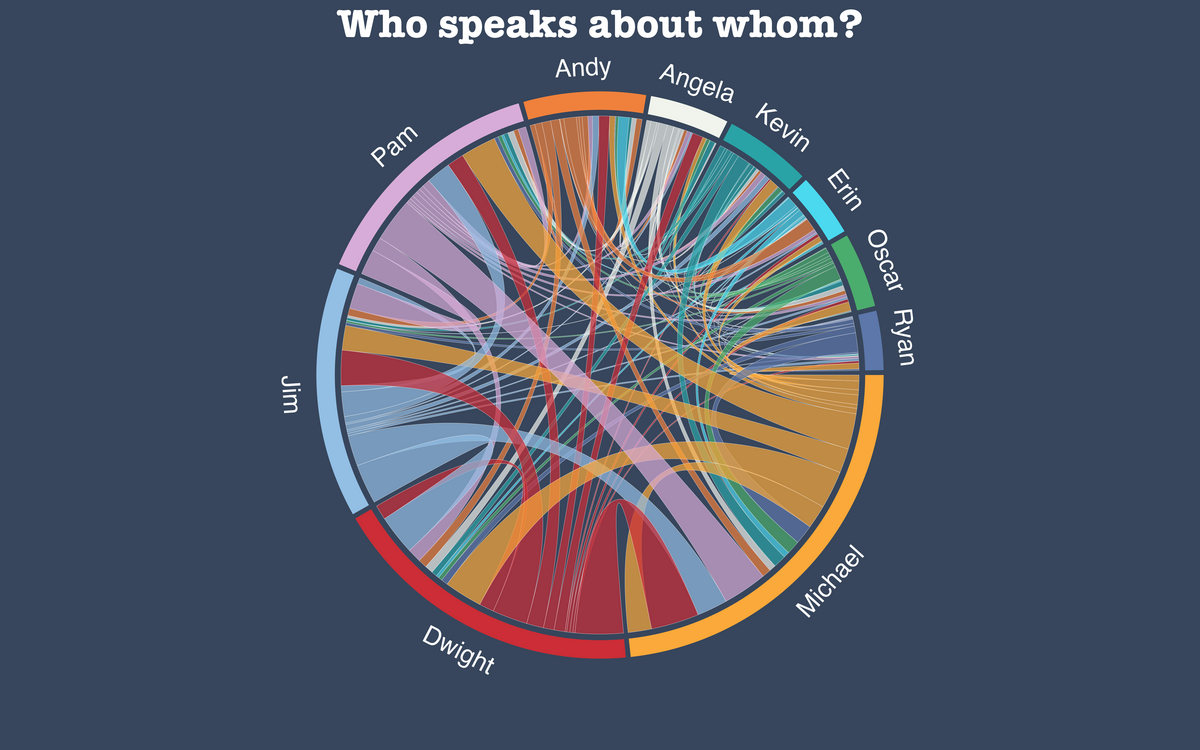
Tutorials written for the R Graph Gallery, each one building a finished, publishable graphic from raw data and explaining the choices along the way: a chord diagram of who speaks about whom across nine seasons of a television series, a Sankey diagram with highlighting, and a Sankey of refugee flows into Europe.
Analysis and visual explanation
Large environmental datasets turned into a readable answer.
Oil slicks and marine protected areas
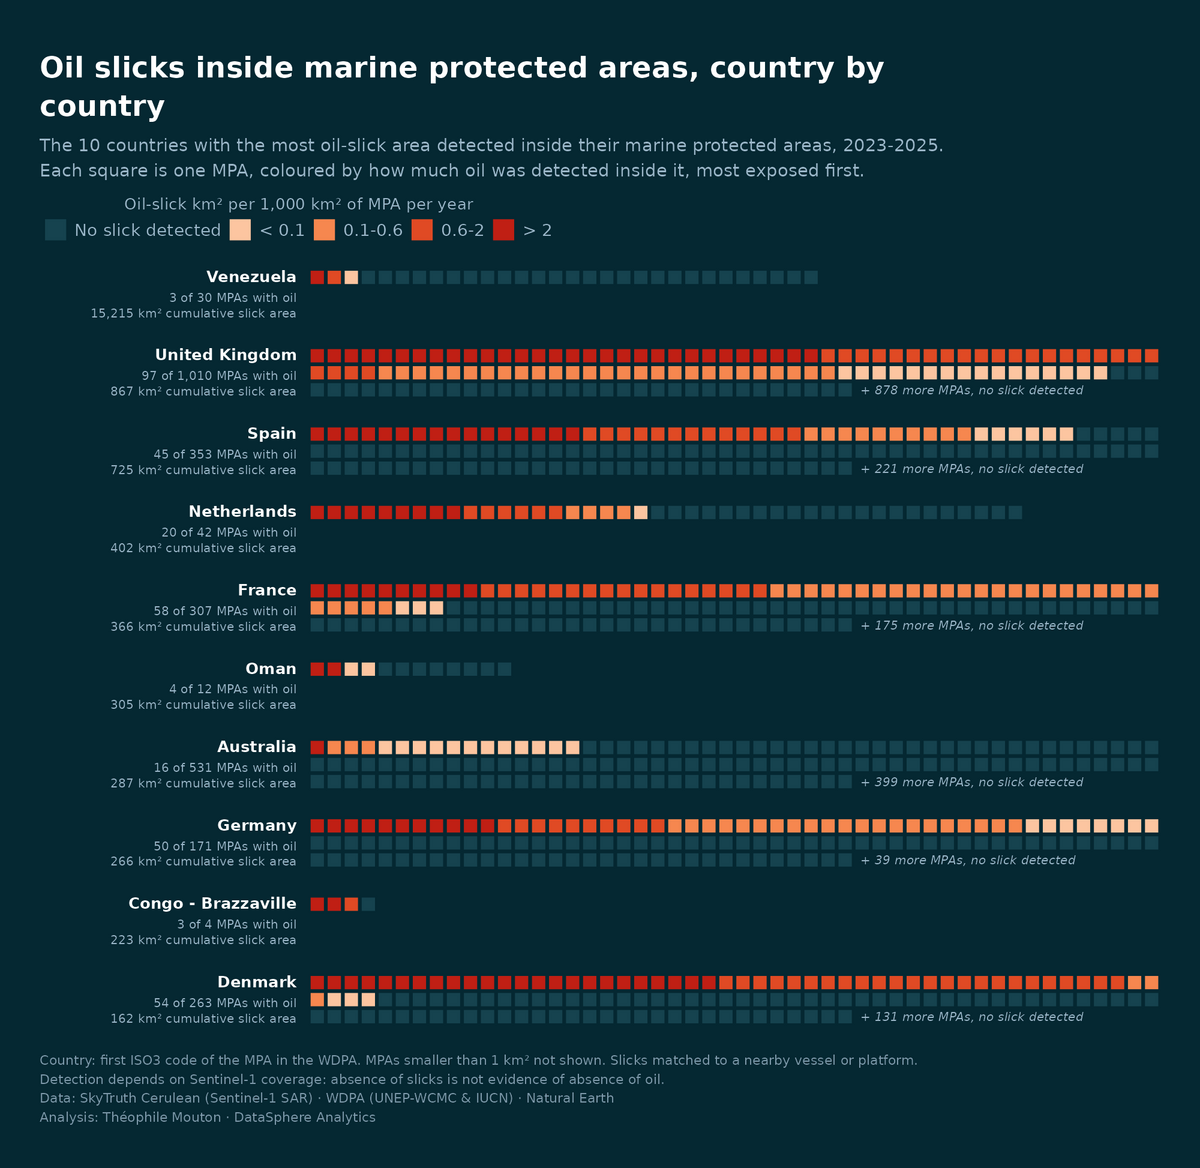
Which countries, and which marine protected areas, are exposed to oil. Satellite-detected slicks from SkyTruth’s Cerulean platform, Sentinel-1 radar with machine-learning detection for 2023 to 2025, intersected with every marine protected area in the World Database on Protected Areas.
A year of Chinese fleet effort
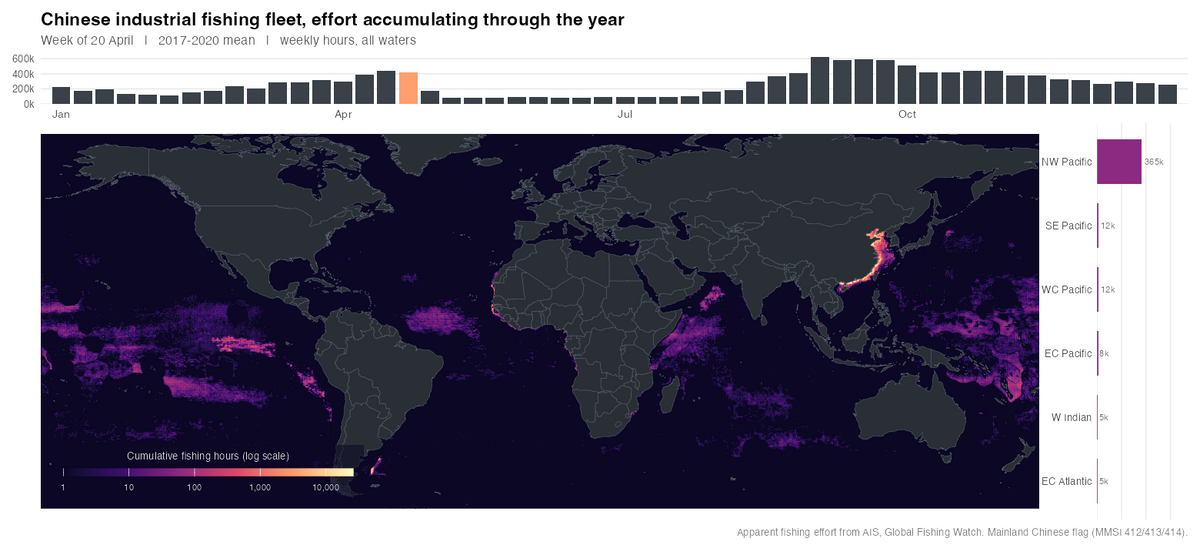
An animated global map accumulating Chinese-flagged fishing hours per 0.25 degree cell from the first week of January, ending on the full annual footprint. A panel above tracks weekly effort across all waters, one to the side breaks the current week down by FAO major fishing area.
Mapping fishing effort beyond AIS
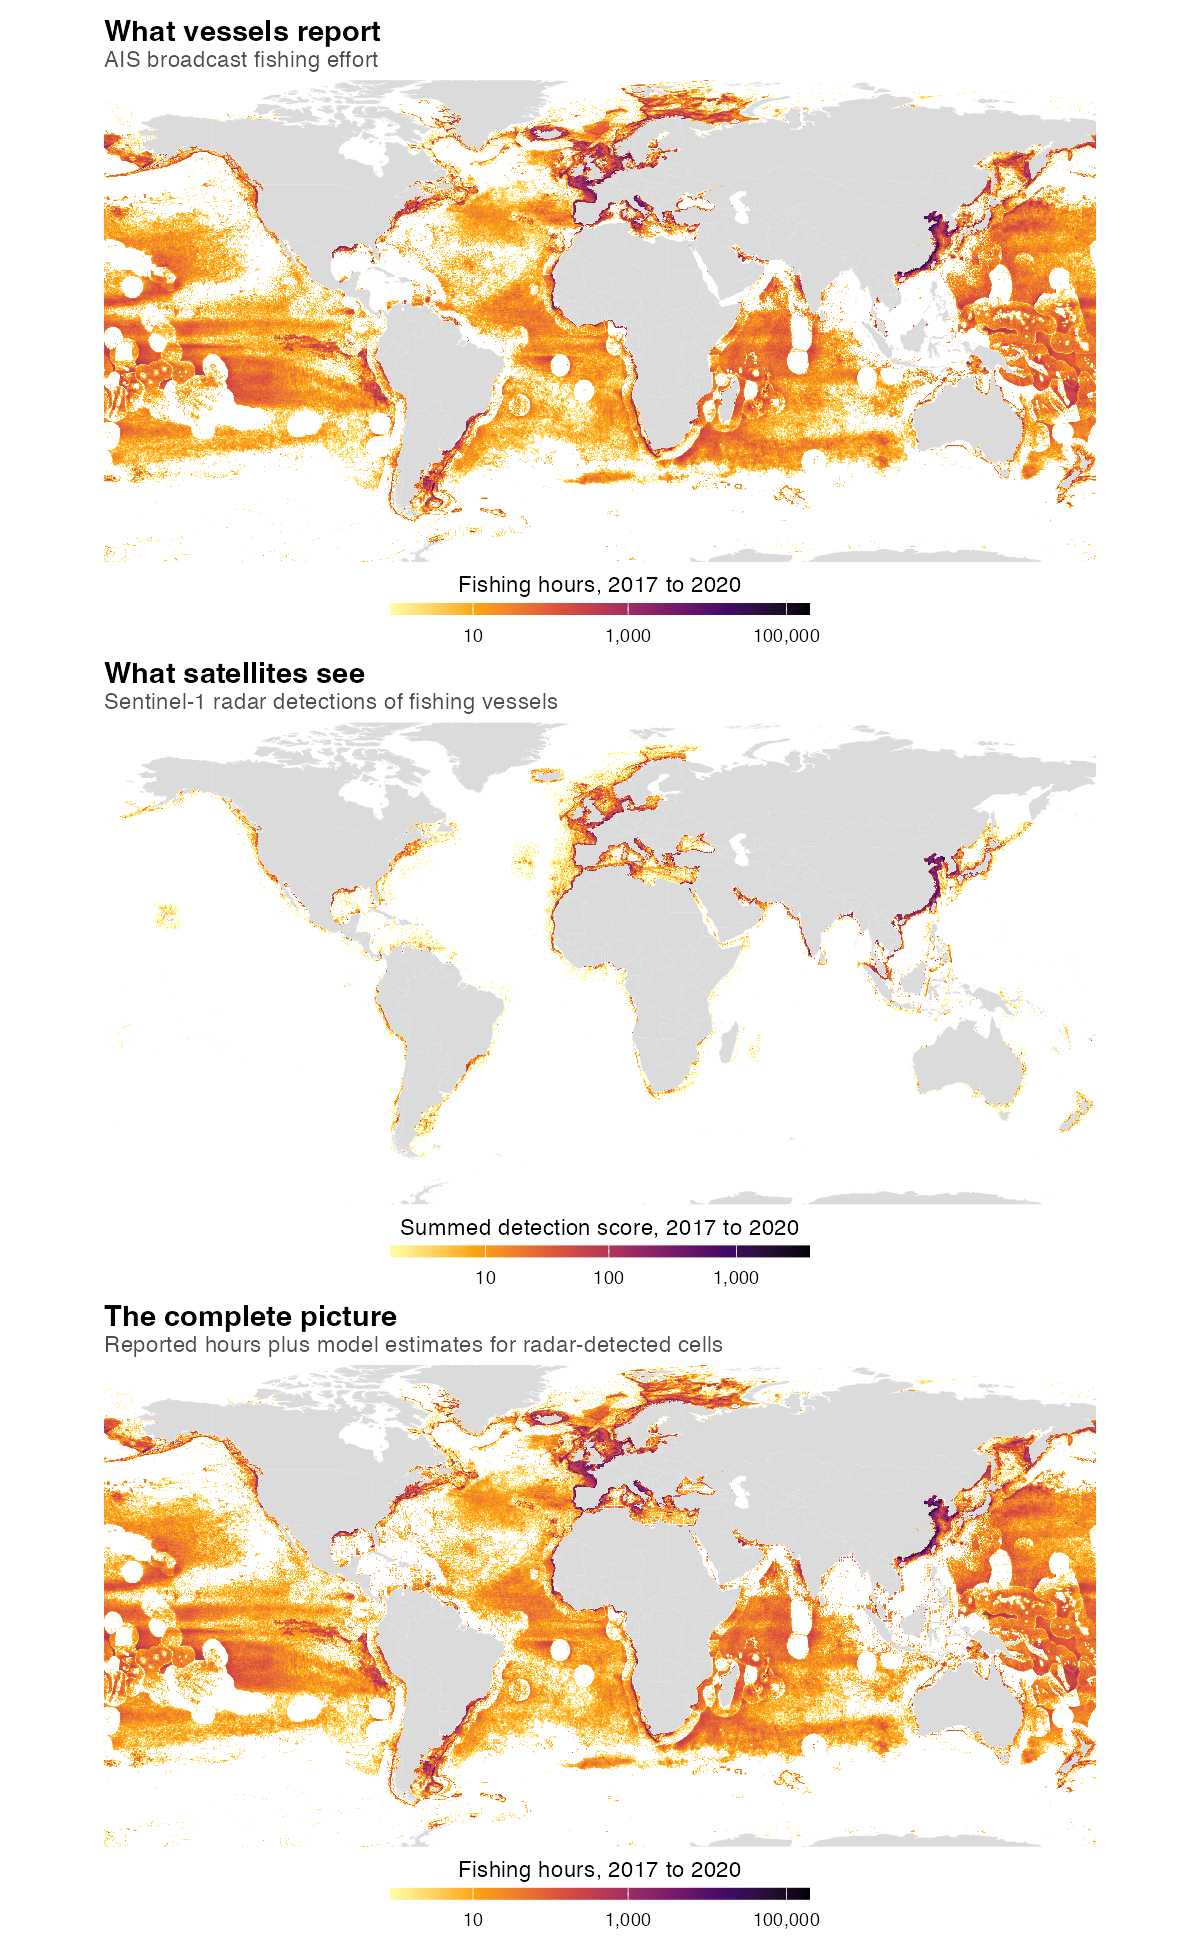
Public monitoring of industrial fishing leans on AIS, and its coverage is uneven: not every vessel carries it, not every vessel keeps it switched on. Radar sees vessels regardless of what they broadcast, but a detection tells you only that something was there. A random forest trained on paired AIS and radar detections converts detections into estimated fishing hours where AIS goes quiet.
What “largest fishing fleet” actually means
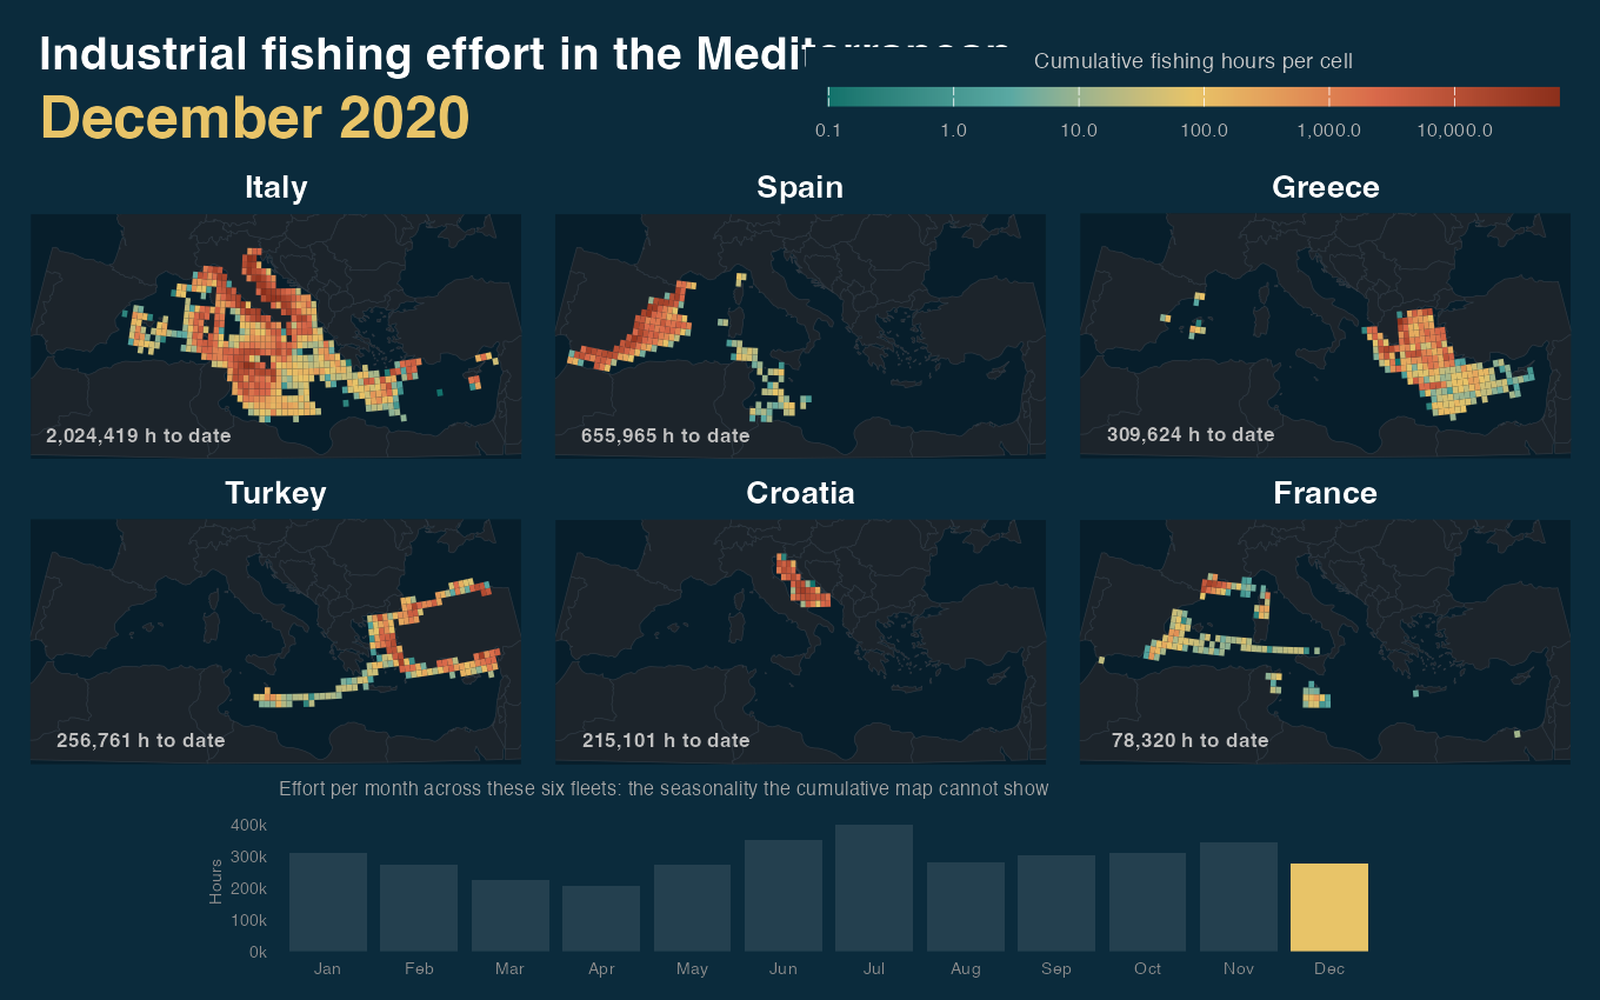
China operates the largest industrial fleet by total hours. Largest changes meaning depending on what you divide by, and dividing by area puts the Mediterranean fleets far above everyone else: Italy applies roughly 3,800 fishing hours to the average 0.5 degree cell it fishes, against about 660 for China across all the world’s oceans. The piece is really about which normalisation tells you something.
Two centuries of American settlement
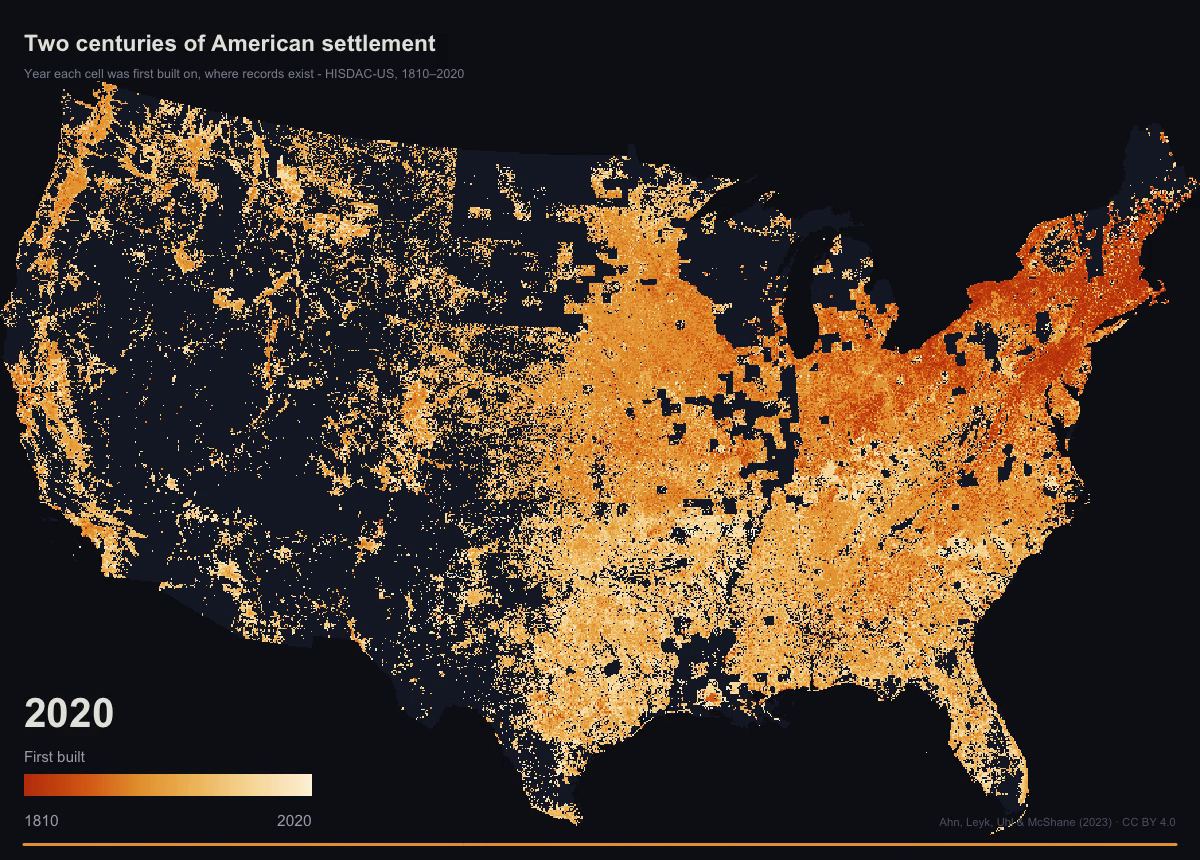
HISDAC-US records, for every 250 m cell of the conterminous United States, the year its first structure appears in the property record. The dataset is cumulative, so the whole 1810 to 2020 animation comes from one raster layer and a moving threshold rather than from 43 separate rasters.
Cetaceans in the Hawaiian Islands EEZ
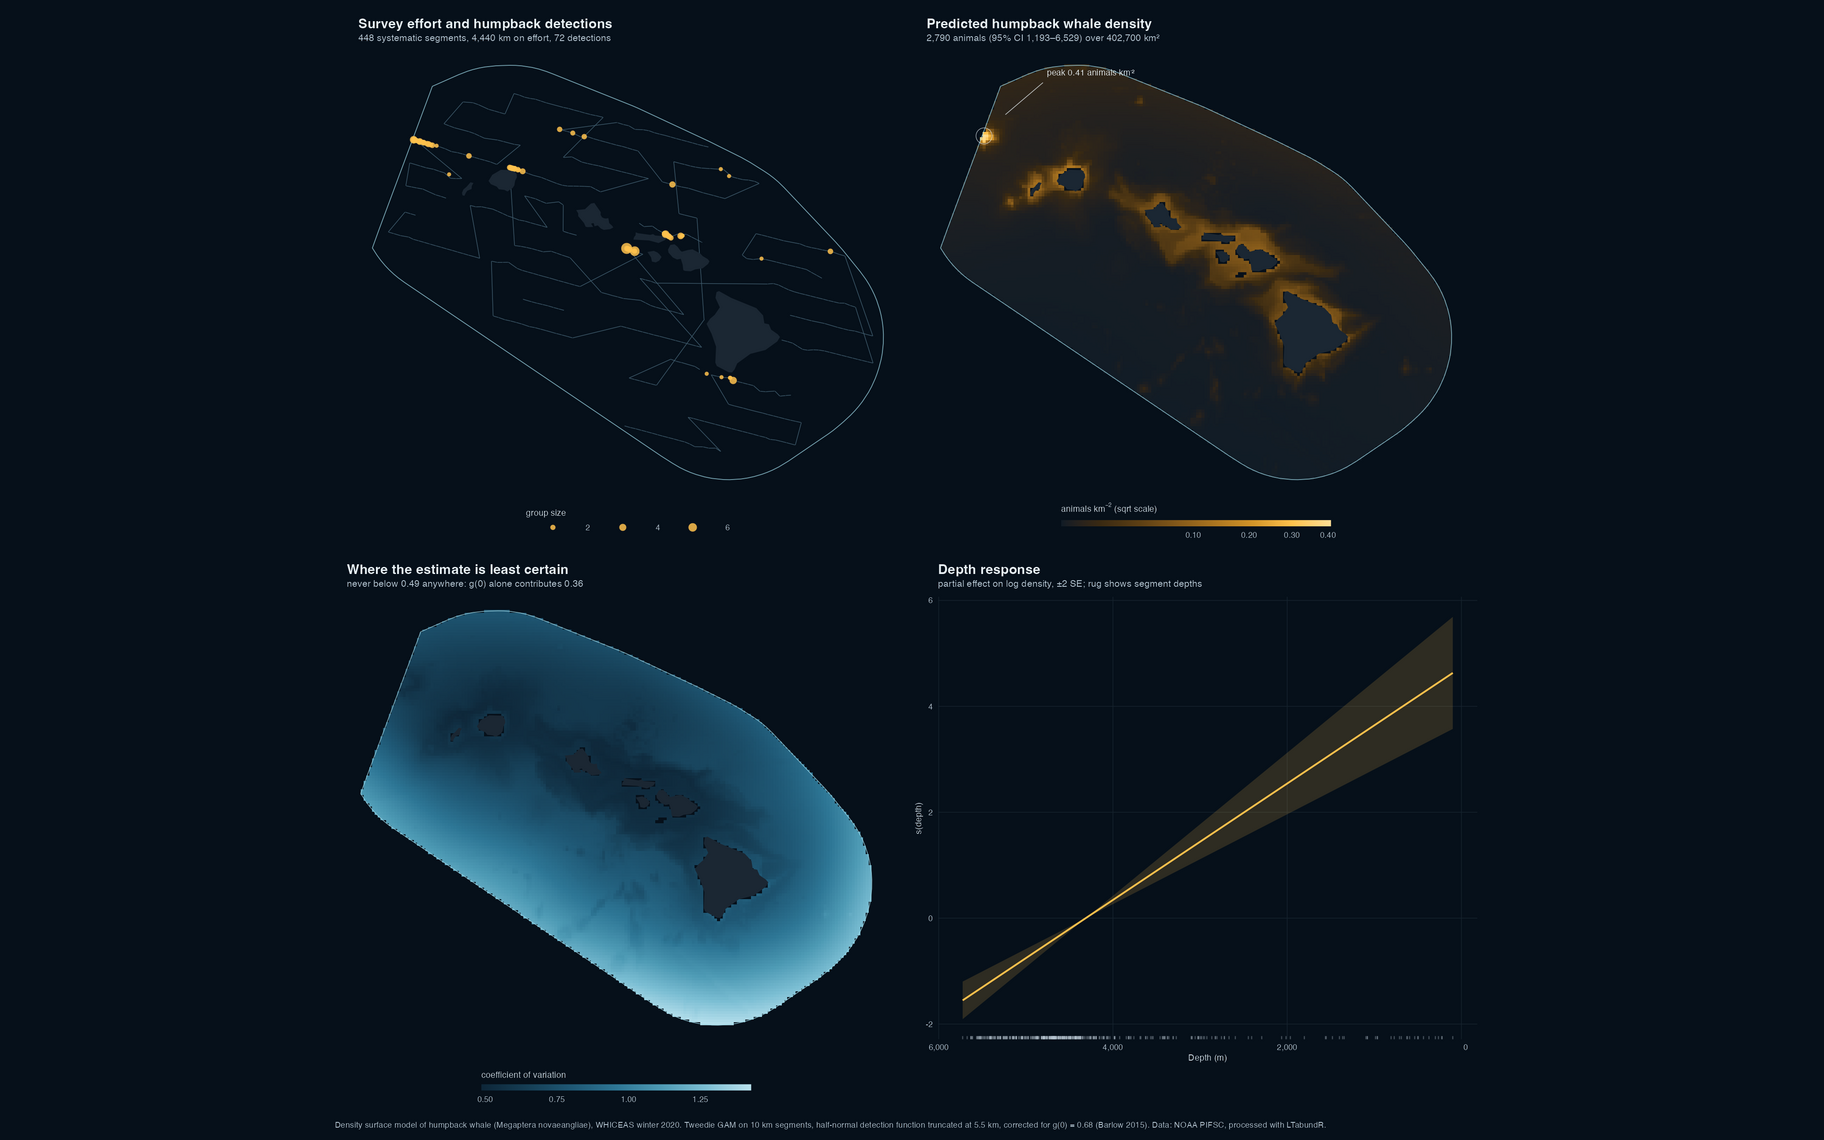
Two analyses of cetacean survey data from the NOAA Pacific Islands Fisheries Science Center, written in R and wrapped as Quarto reports: an animated map of seasonal sighting records, and a density surface model for humpback whales.
Research
Twelve peer-reviewed articles. Full list on Google Scholar.
First author
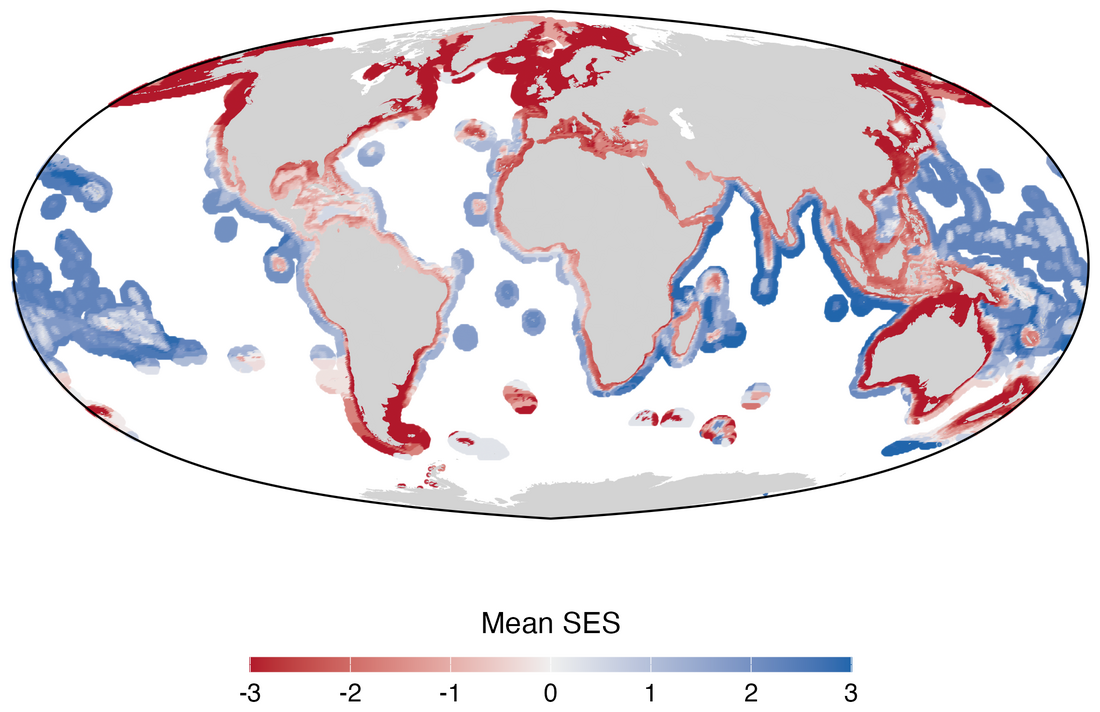
Global gaps and priorities for shark and ray conservation
Mouton T.L., Silvestro D., Kocáková K., Spitznagel D., Leprieur F., Pimiento C. (2025). bioRxiv 2025.11.28.691085.
A global prioritisation of 1,192 shark and ray species integrating threat status, functional distinctiveness and evolutionary distinctiveness. Species range overlap with the no-take marine protected area network is compared against null models of random placement, and a reinforcement learning algorithm (CAPTAIN) identifies spatial priorities at a 10% protection budget aligned with Target 3 of the Global Biodiversity Framework.
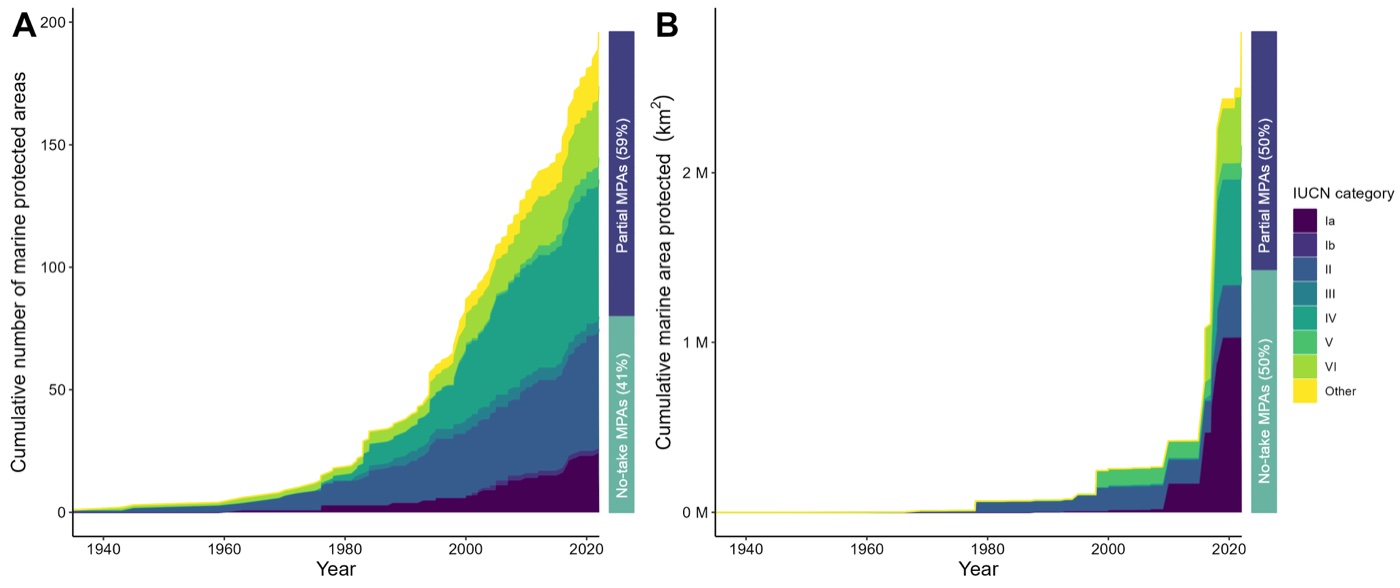
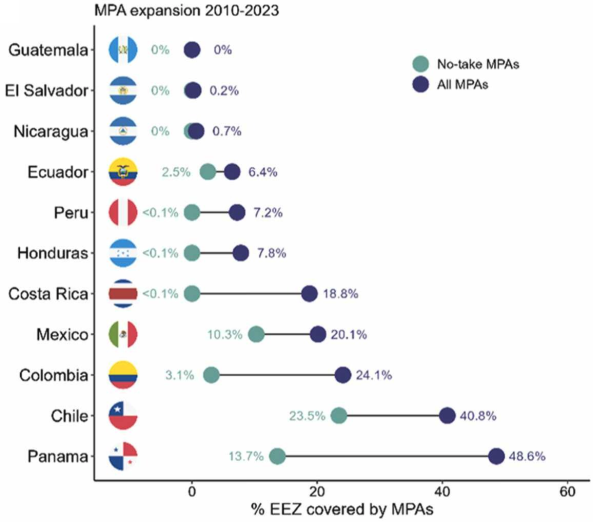
Shortfalls in the protection of Important Shark and Ray Areas
Mouton T.L., Gonzalez-Pestana A., Rohner C.A., Charles R., et al. (2025). Marine Policy 171, 106448.
Led with 45 co-authors from academia, governments and NGOs under Rima Jabado, Chair of the IUCN SSC Shark Specialist Group. Trends in marine protected area expansion across 12 nations of the Central and South American Pacific, the spatial overlap between those areas and Important Shark and Ray Areas, and whether the governance in place actually protects critical habitat. Important Areas overlap all protected areas by 15.6% and no-take areas by 7.3%; 41.8% of the 182 protected areas have no management plan.

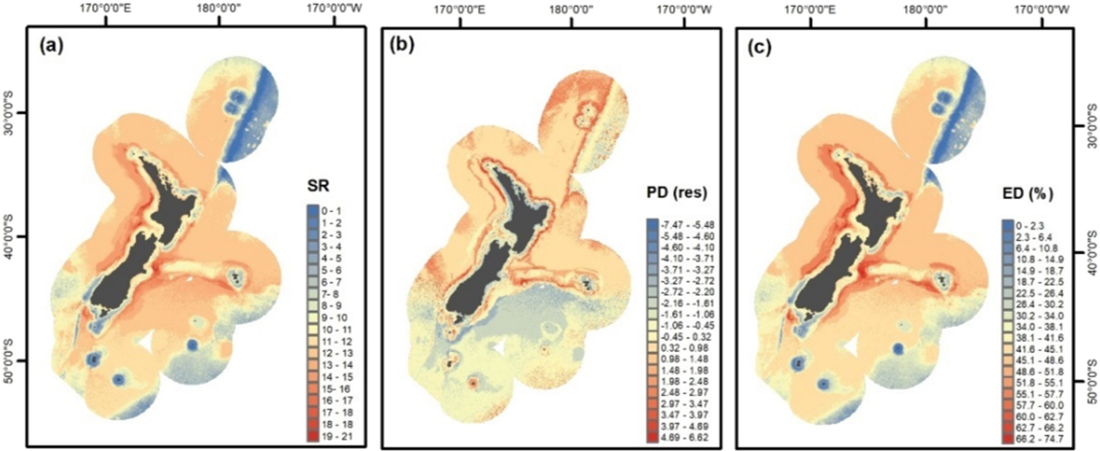
Spatial mismatch in diversity facets and New Zealand's cetacean biodiversity
Mouton T.L., Stephenson F., Torres L.G., Rayment W., Brough T., McLean M., Tonkin J.D., Albouy C., Leprieur F. (2022). Biological Conservation 267, 109484.
Taxonomic, functional and phylogenetic diversity of cetaceans modelled across New Zealand waters, testing where hotspots of richness and of uniqueness agree and where they do not, and measuring how much individual species contribute to each facet.

Climate and land-use driven reorganisation of river communities
Mouton T.L., Leprieur F., Floury M., Stephenson F., Verburg P., Tonkin J.D. (2022). Ecography 2022(3), e06148.
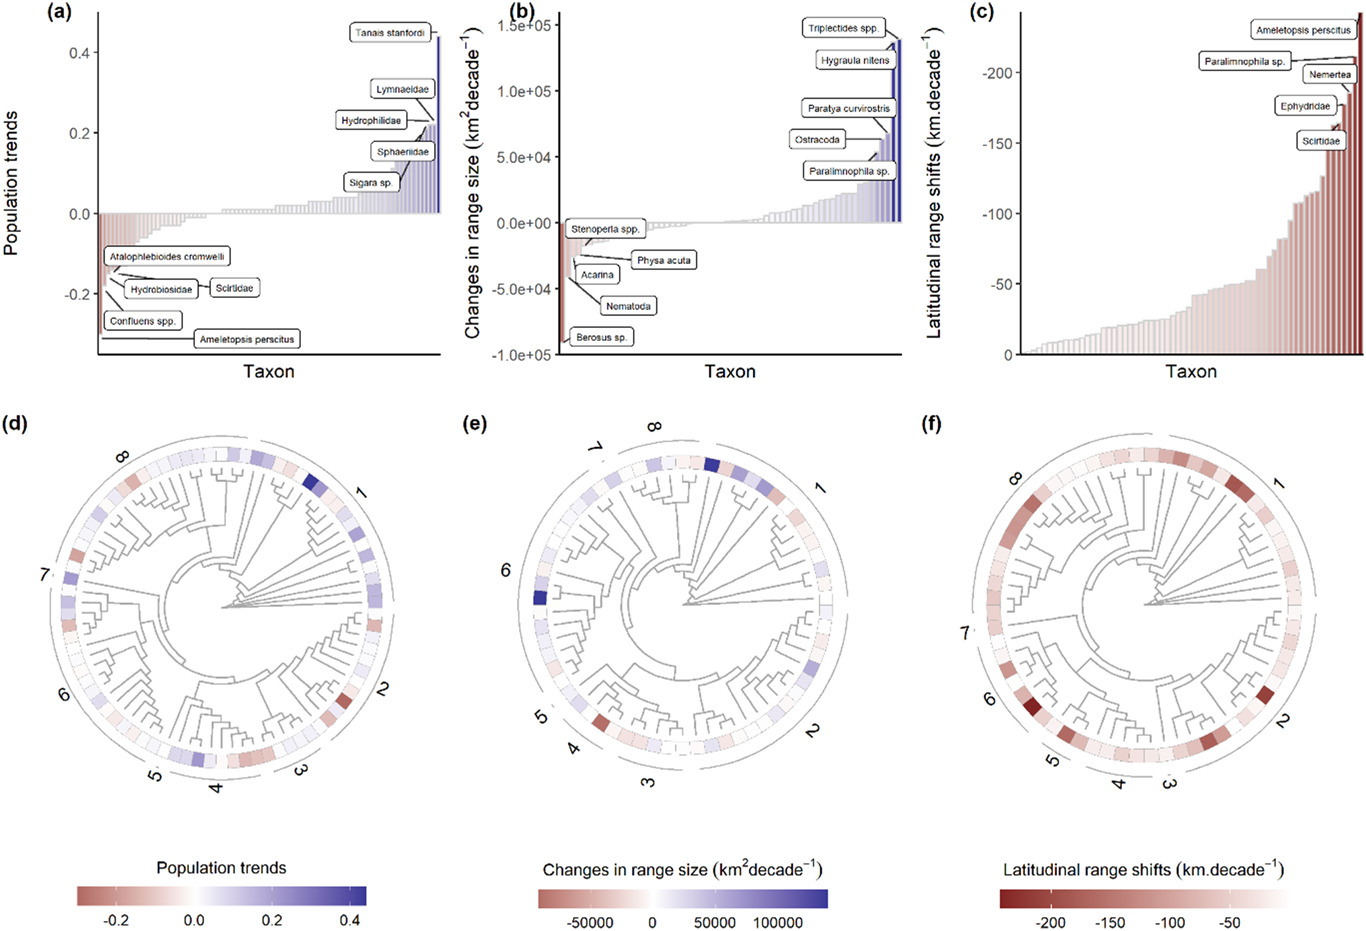
Changes in population size and range shifts across a national macroinvertebrate species pool, related to taxonomy and functional traits. Increases in population and range size were more common than decreases, and species shifted towards higher latitudes by around 50 km per decade, with distinct trait signatures but little taxonomic signal.


Taxonomic homogenization but functional differentiation in rivers
Mouton T.L., Tonkin J.D., Stephenson F., Verburg P., Floury M. (2020). Global Change Biology 26(12), 6904-6915.
Thirty years of New Zealand national monitoring data analysed with hierarchical generalised additive models to test for temporal change in taxonomic and functional beta-diversity. The long-term trend is towards taxonomic homogenization and, at the same time, functional differentiation, mostly climate-driven.

Environmental filtering of stream macrophytes by habitat disturbance
Mouton T.L., Matheson F.E., Stephenson F., Champion P.D., Wadhwa S., Hamer M.P., Catlin A., Riis T. (2019). Science of the Total Environment 659, 1370-1381.
First paper, written at NIWA. A database of native and non-native macrophyte abundance across Waikato streams, an 11-trait matrix and associated natural and human-driven processes, analysed with RLQ ordination, multidimensional functional diversity indices and model averaging. Reach-scale habitat disturbance favours more productive species and, with them, non-native abundance.
Co-author
Only one percent of Important Shark and Ray Areas in the Western Indian Ocean are fully protected from fishing pressure
Cochran J.E.M., Charles R., Temple A.J., Kyne P.M., García-Rodríguez E., et al. (2026). Ecology and Evolution 16, e72690.
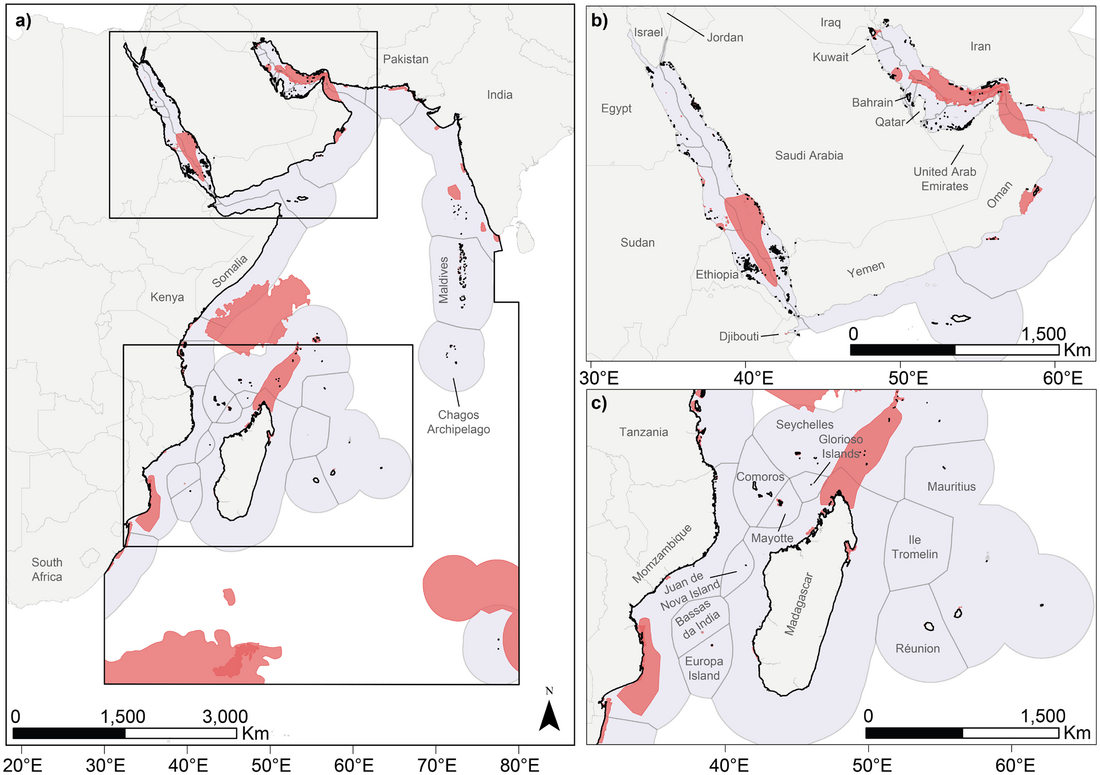
The Important Shark and Ray Areas delineated for the Western Indian Ocean set against jurisdictions, the protected area network and the evidence base behind them. The areas hold 104 of the region’s 270 chondrichthyan species, 76% of them threatened with extinction, yet only 7.1% of their extent falls within designated marine protected areas and 1.2% within fully protected no-take areas. The supporting evidence leans on inexpensive methods, visual census, landing site surveys and citizen science, and carries the same biases as the published record towards large, wide-ranging, shallow species.
Important Shark and Ray Areas can inform conservation planning in the Mediterranean and Black Seas
Rohner C.A., Richardson A.J., García-Rodríguez E., Charles R., et al. (2025). iScience 113192.
Pairs the Important Shark and Ray Areas of the Mediterranean and Black Seas with a basin-scale spatial prioritisation, with fishing pressure derived from Global Fishing Watch AIS data supplemented by satellite detections where AIS coverage is absent.
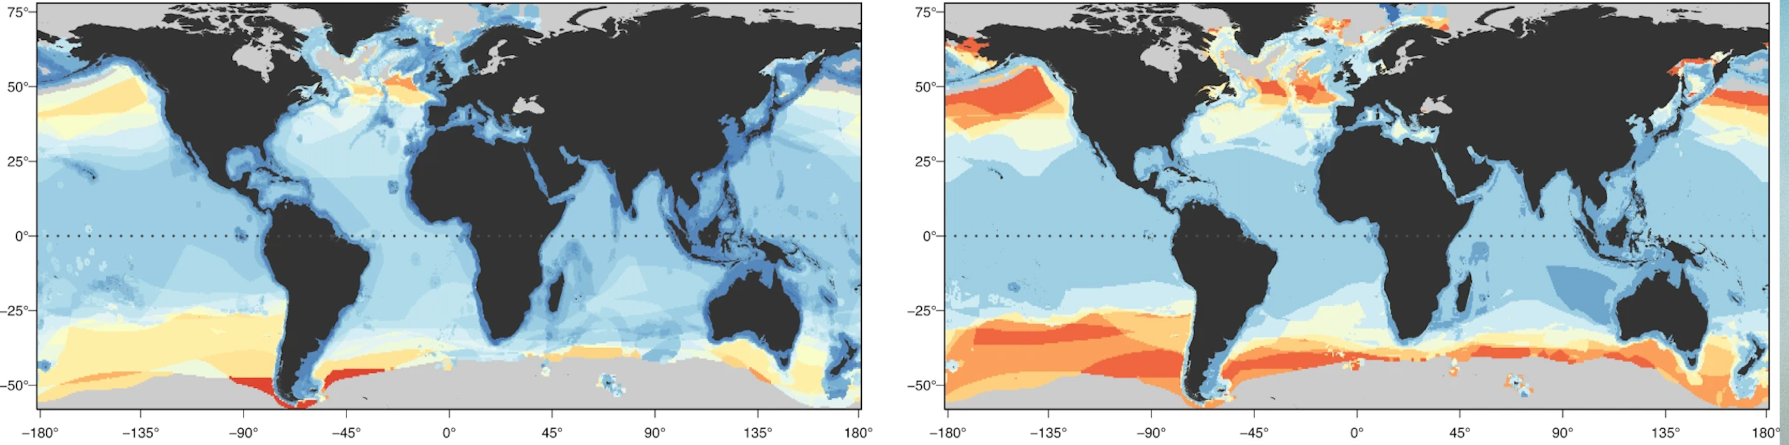
Functional diversity of sharks and rays is highly vulnerable and supported by unique species and locations worldwide
Pimiento C., Albouy C., Silvestro D., Mouton T.L., Velez L., Mouillot D., Judah A.B., Griffin J.N., Leprieur F. (2023). Nature Communications 14(1), 7691.
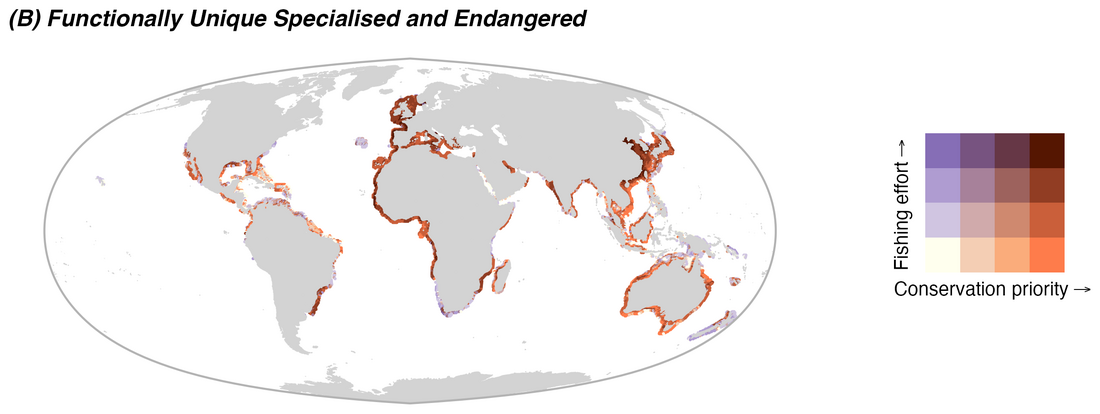
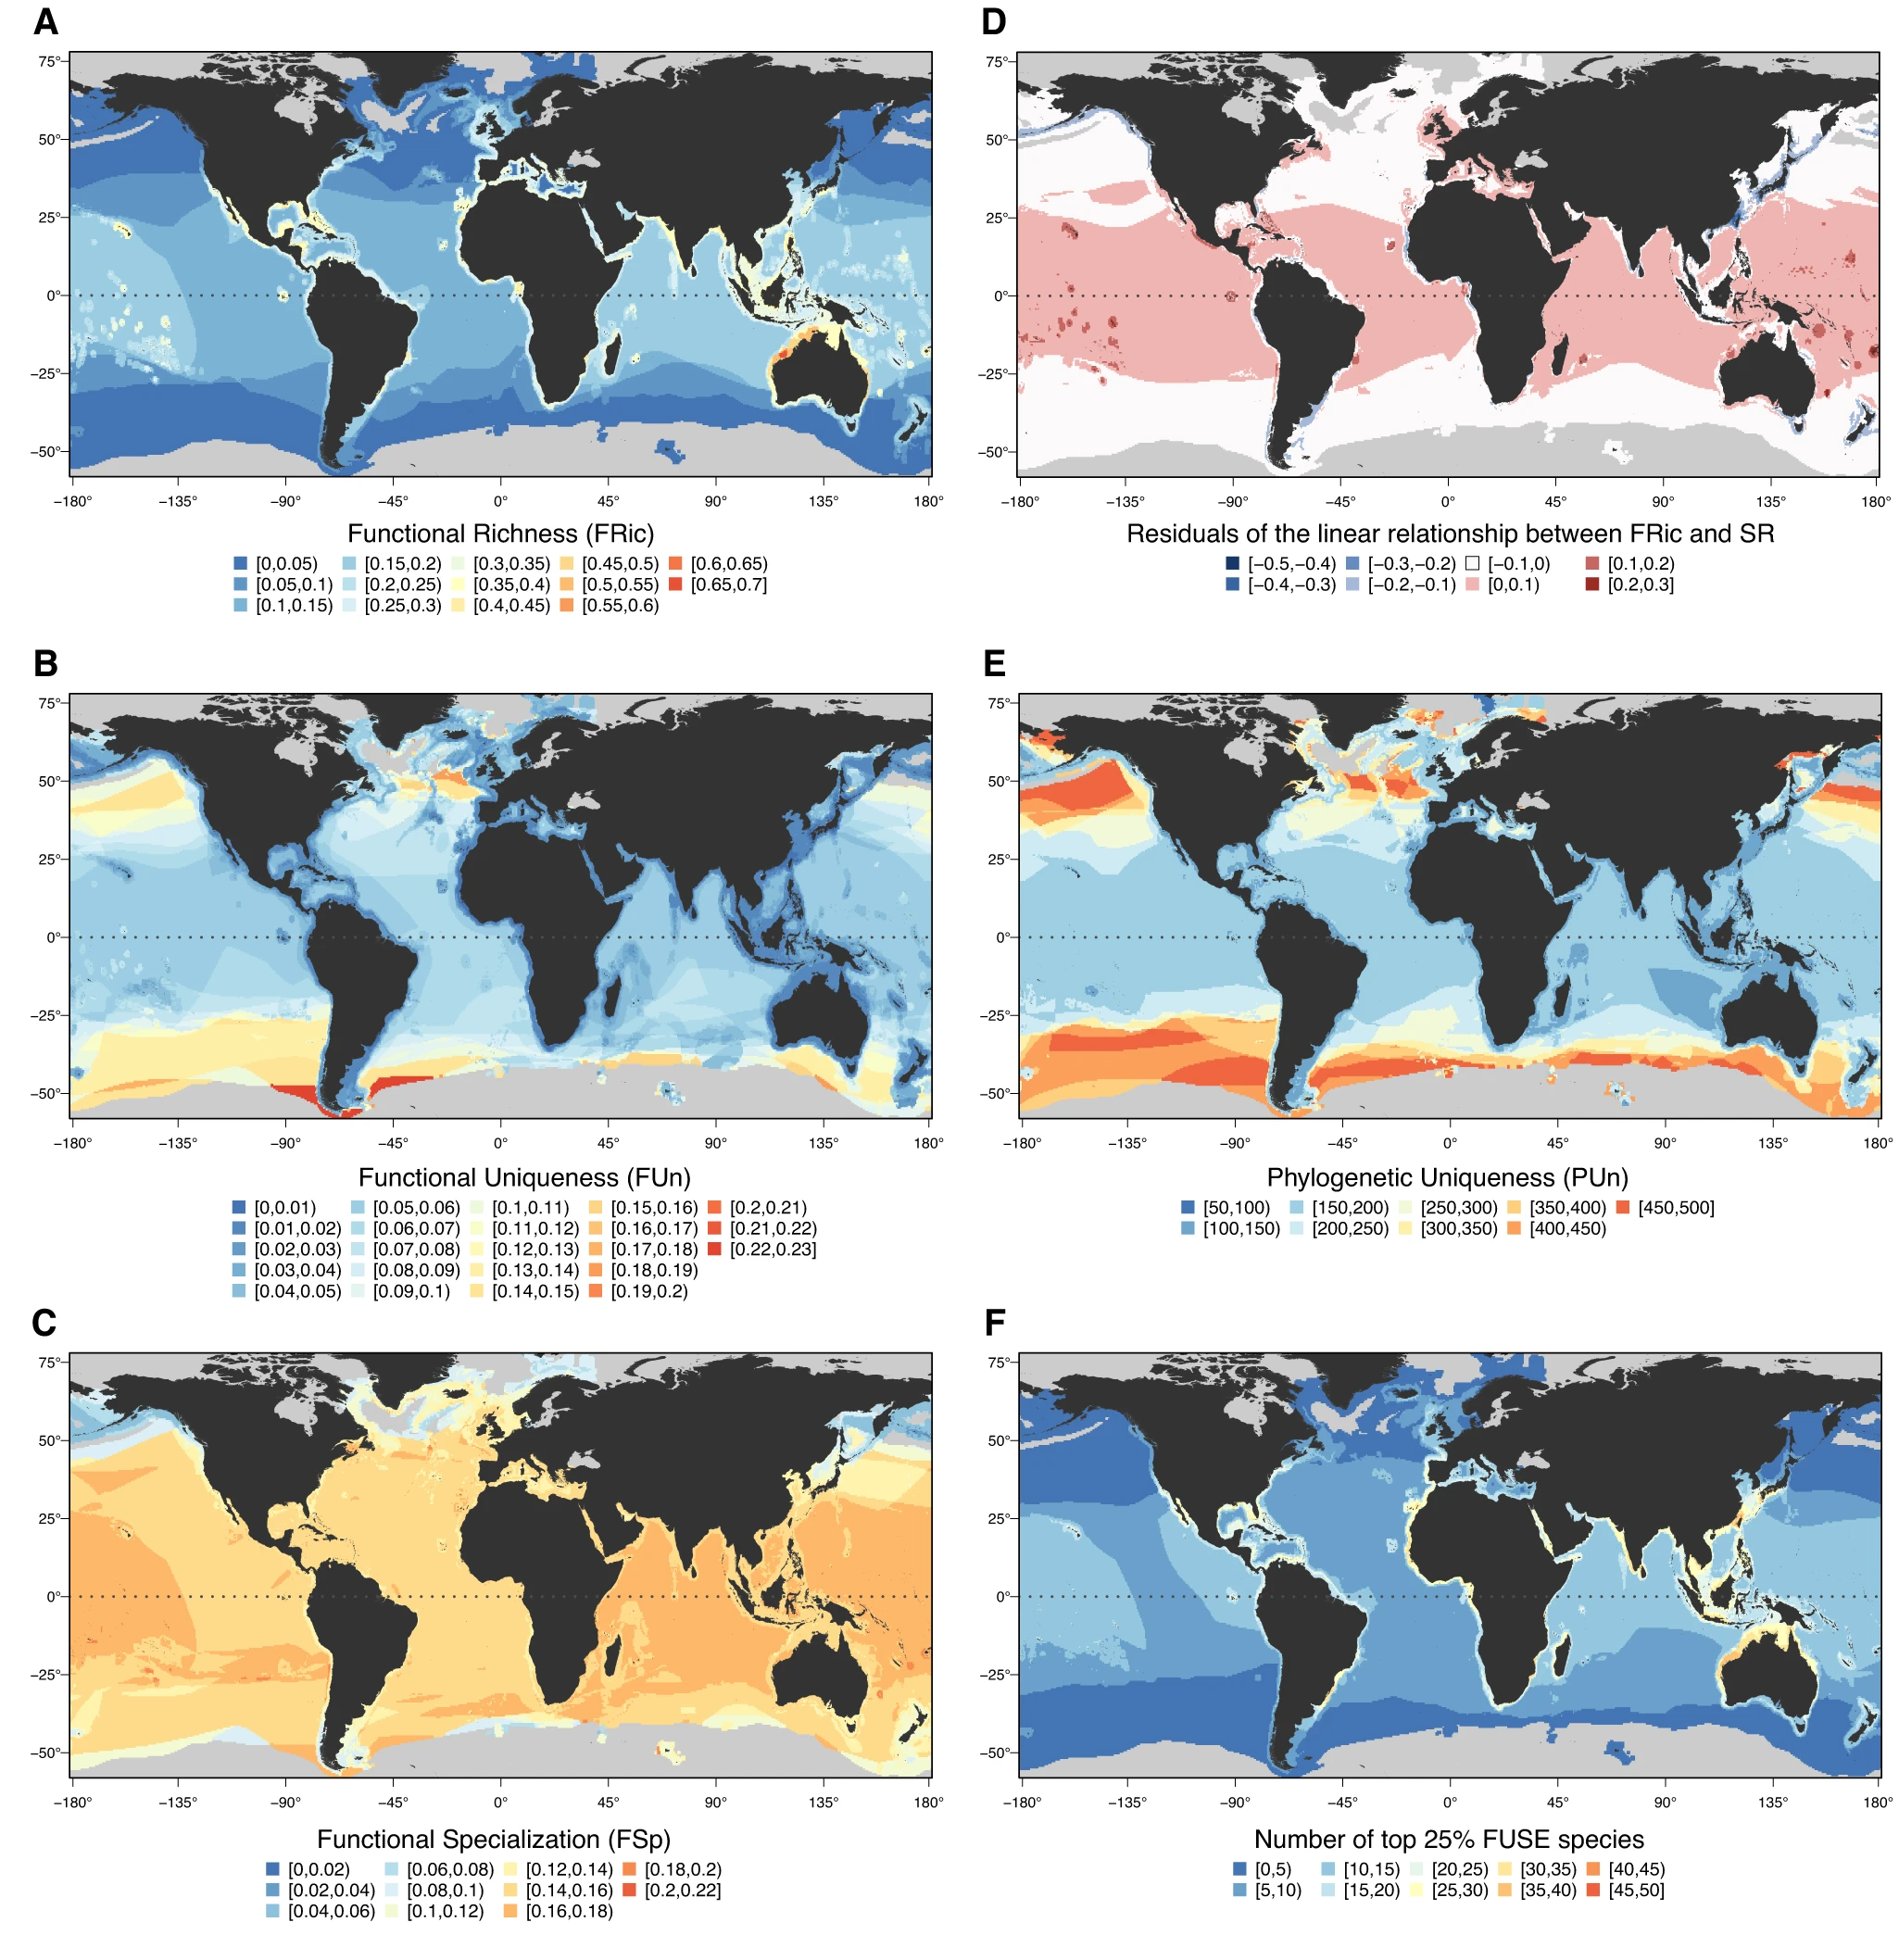
A trait dataset of more than 1,000 species used to map elasmobranch functional diversity against taxonomic and phylogenetic facets. Functional richness concentrates on continental shelves and around oceanic islands in 18 hotspots that barely overlap the other facets, and converges with fishing pressure along the coast of China. The maps here show, for each facet, where diversity is concentrated and where it is uniquely supported by a handful of species. Because those species carry traits nothing else in the assemblage replaces, losing them removes function from the system faster than a count of species would suggest, which is the argument the paper makes for weighting conservation towards functional distinctiveness rather than richness alone.
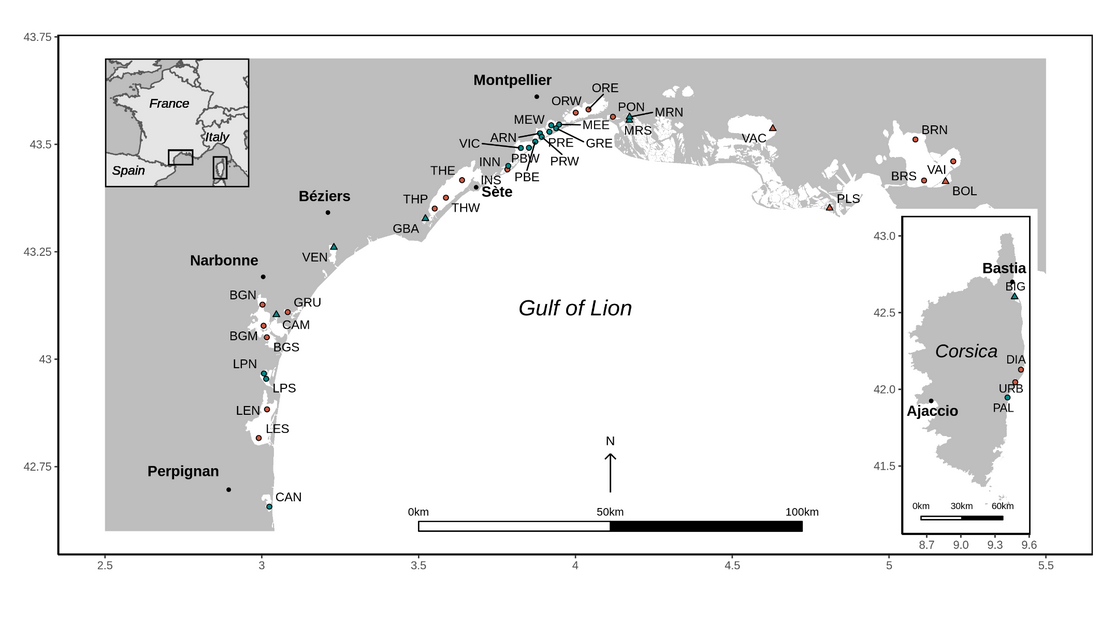
Disentangling the effects of eutrophication and natural variability on macrobenthic communities across French coastal lagoons
Jones A.G., Schaal G., Boyé A., Creemers M., Derolez V., Desroy N., et al. (2024). Peer Community Journal 4, e112.
Macrobenthic invertebrate abundance and hydro-morphological, water, sediment and macrophyte variables across 29 French Mediterranean coastal lagoons, analysed with correlograms, linear models and variance partitioning. Lagoon hydro-morphology and habitat diversity set community composition; eutrophication acts on the communities already there, mainly by reducing richness and diversity. M-AMBI, the index used to grade the ecological state of these lagoons, responds more to eutrophication than to natural variability, but 49% of its variance is shared between the two.

Cetacean conservation planning in a global diversity hotspot
Stephenson F., Hewitt J.E., Torres L.G., Mouton T.L., Brough T., Goetz K.T., et al. (2021). Ecosphere 12(7), e03633.
Spatial prioritisation with Zonation to identify cetacean richness hotspots, testing how different levels of uncertainty in the underlying occurrence layers change which areas come out as priorities.

Modelling the spatial distribution of cetaceans in New Zealand waters
Stephenson F., Goetz K., Sharp B.R., Mouton T.L., Beets F.L., Roberts J., et al. (2020). Diversity and Distributions 26(4), 495-516.
A national database of more than 7,000 at-sea cetacean sightings, with boosted regression trees and relative environmental suitability models predicting the distribution of 30 species and species richness across the New Zealand EEZ. A companion report was prepared for Fisheries New Zealand.
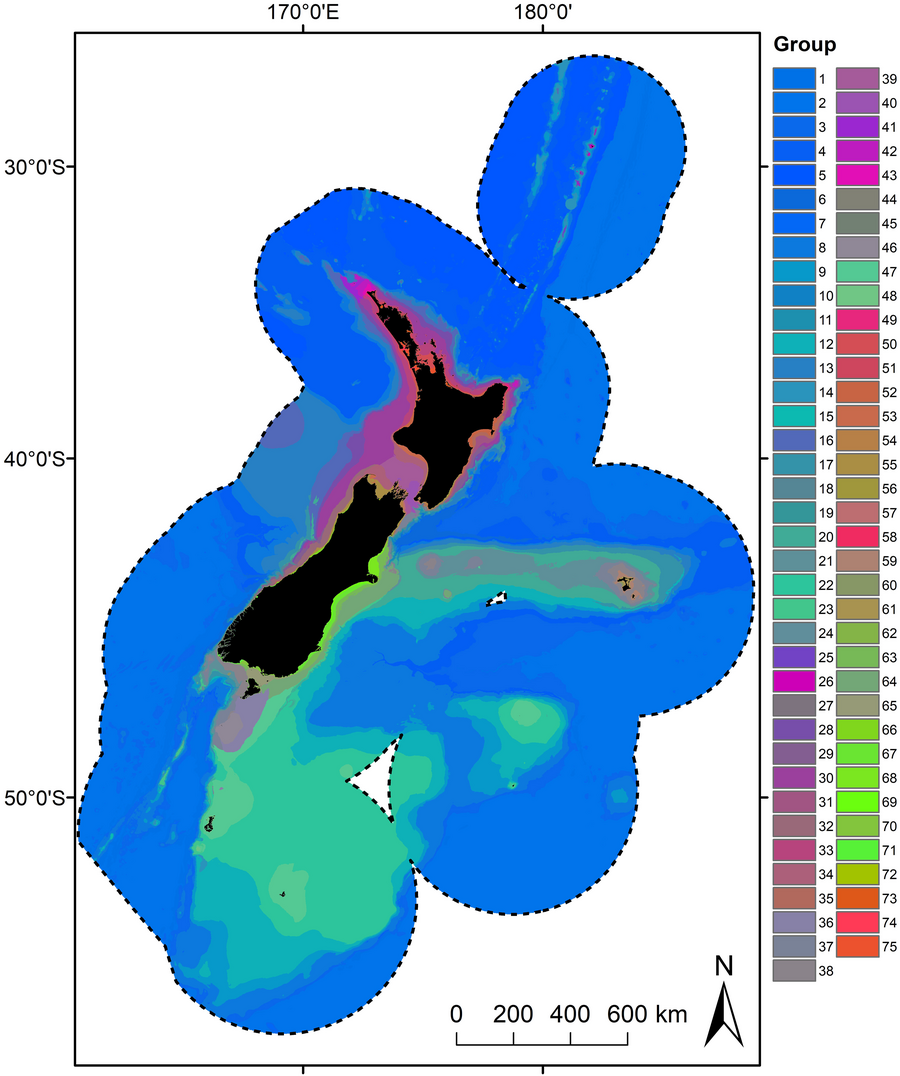
Development of a seafloor community classification for the New Zealand region using a gradient forest approach
Stephenson F., Rowden A.A., Brough T., Petersen G., Bulmer R.H., et al. (2022). Frontiers in Marine Science 8, 792712.
Gradient forest models of compositional turnover for demersal fish, reef fish, benthic invertebrates and macroalgae across the New Zealand region, combined into a single classification of the seafloor at 75 groups, with a spatially explicit estimate of uncertainty and of environmental coverage alongside it. The classification underpins marine spatial planning and ecosystem-based management advice for New Zealand waters.
