Research
My research uses large biodiversity, environmental and satellite datasets to ask where species are, how they are changing, and whether protection and management are keeping up. It runs from New Zealand rivers and coastlines to the global ocean, and almost all of it is built as reproducible code.
In each list, a dark bar marks a first-author paper.
Global macroecology
Area-based management and conservation prioritisation
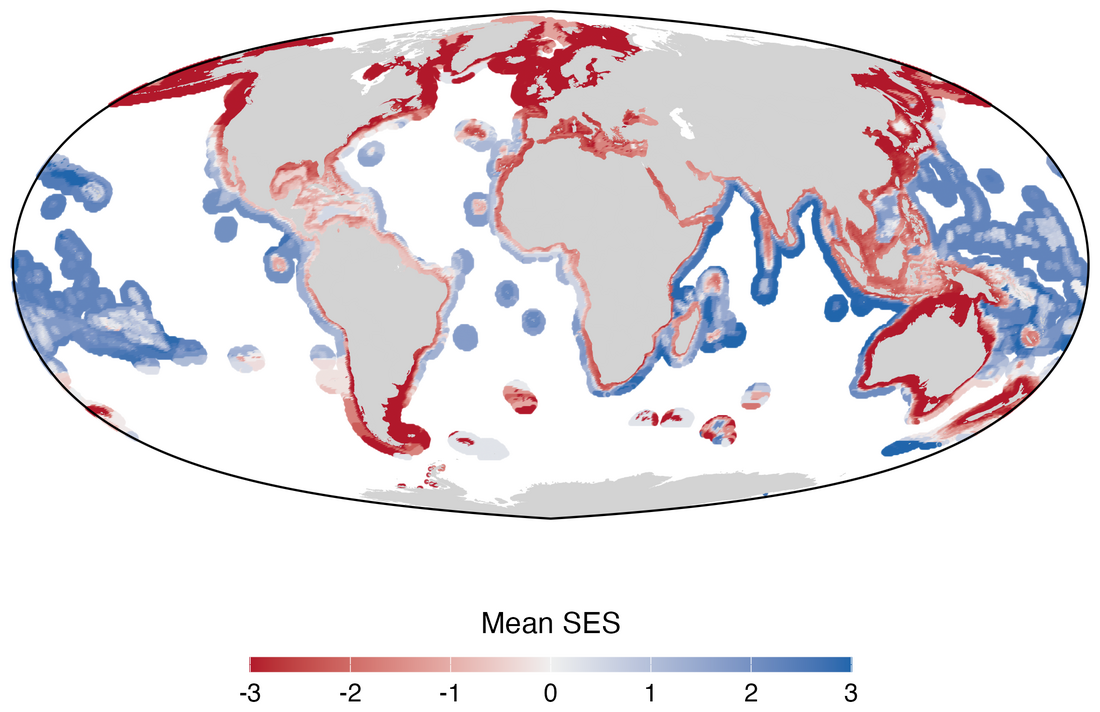
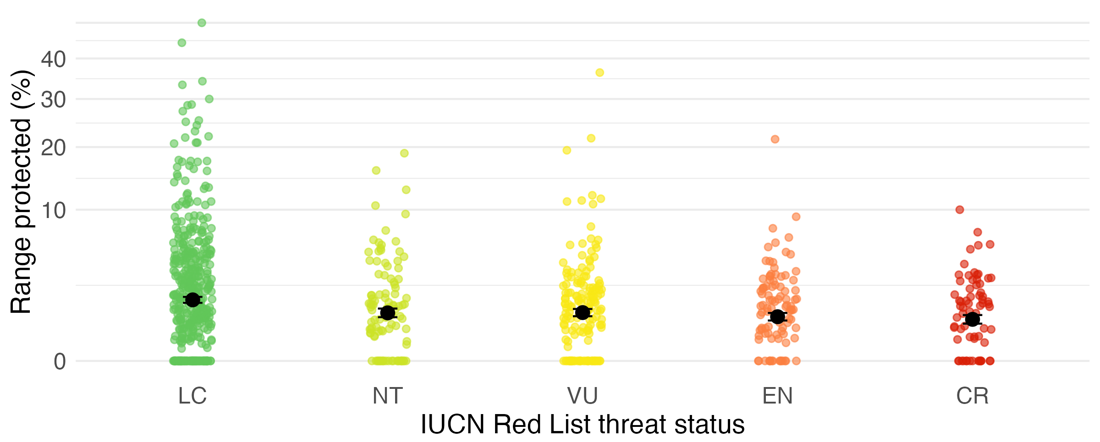
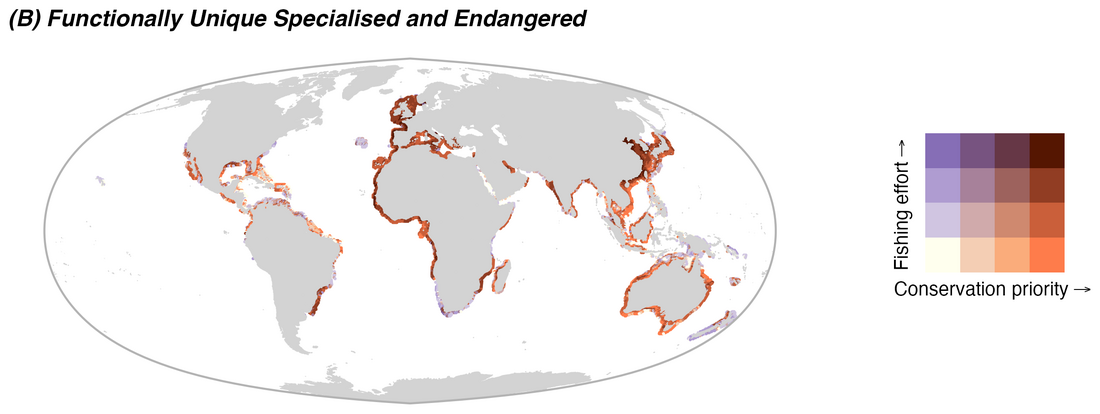
How well does the global network of marine protected areas cover biodiversity, and where should new protection go? With the Pimiento Research Group, I combined range maps for about 1,000 species with measures of extinction risk, ecological function and evolutionary history. I ran a gap analysis against a spatially explicit null model, then used reinforcement learning to optimise where a 10% protection target would do the most good, set against where industrial fishing concentrates.
The study system is sharks and rays, one of the most threatened groups in the ocean; the methods apply to any taxon or region.
- Mouton T.L. et al. Global gaps and priorities for shark and ray conservation. bioRxiv preprint 2025
- Pimiento C. et al. Functional diversity of sharks and rays is highly vulnerable and supported by unique species and locations worldwide. Nature Communications 2023
- Kocáková K. et al. FINS: a global occurrence dataset of fossil neoselachians. Global Ecology and Biogeography 2026 (app)
Science to policy
Protection gaps in critical habitat
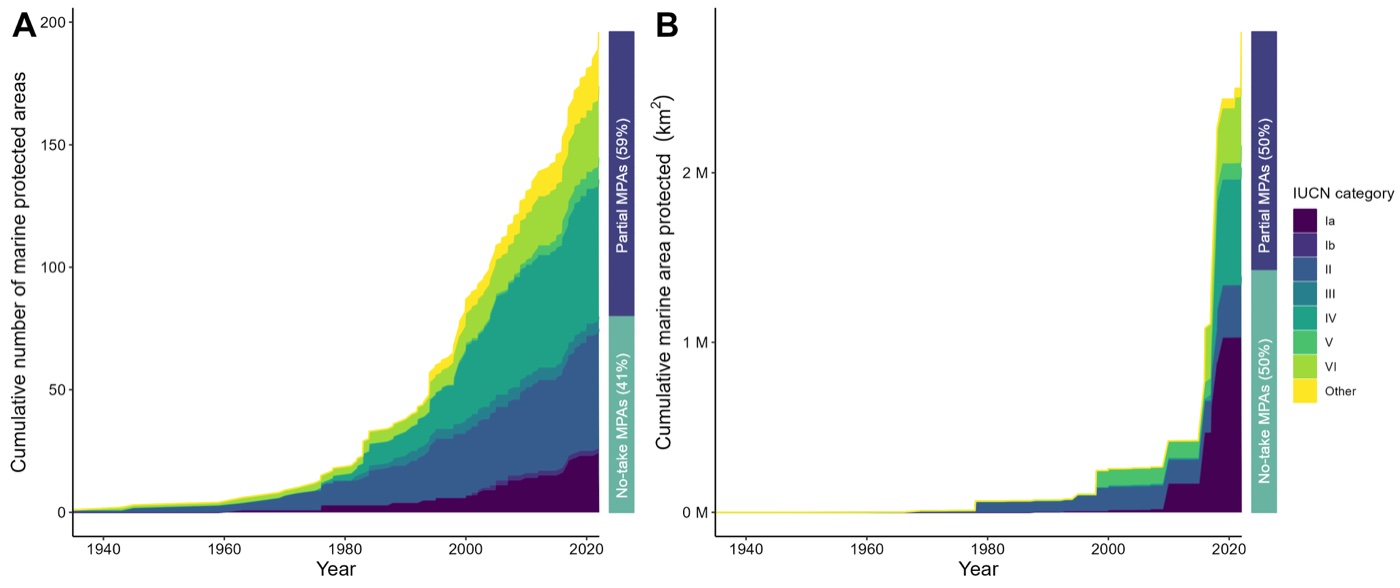
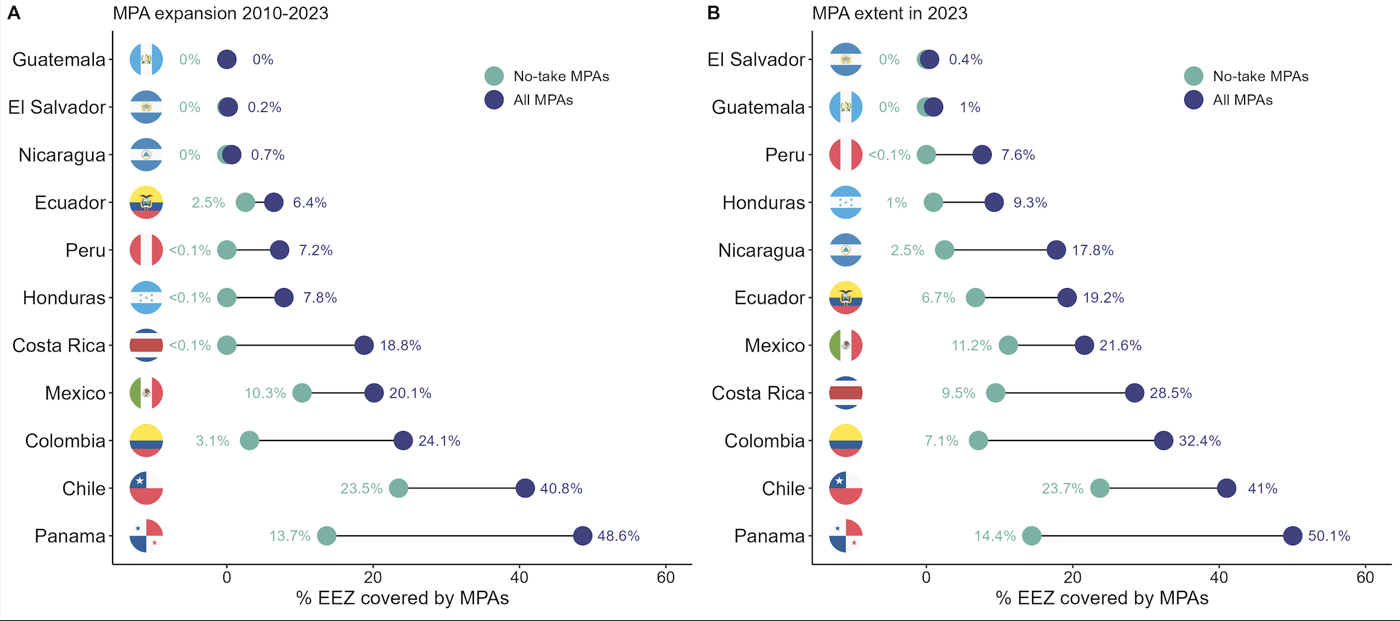
As scientific coordinator for the IUCN SSC Shark Specialist Group, I worked with more than 60 experts to identify Important Shark and Ray Areas, then tested how well existing protected areas actually cover them. The answer, region after region, is very little, especially once fishing is taken into account.
- Mouton T.L. et al. Shortfalls in the protection of Important Shark and Ray Areas undermine shark conservation efforts in the Central and South American Pacific. Marine Policy 2024
- Cochran J.E.M. et al. Only one percent of Important Shark and Ray Areas in the Western Indian Ocean are fully protected from fishing pressure. Ecology and Evolution 2026
- Rohner C.A. et al. Important Shark and Ray Areas can inform conservation planning in the Mediterranean and Black Seas. iScience 2025
- Regional compendia: Mediterranean and Black Seas 2023, Western Indian Ocean 2024
Open analyses
Human pressure at sea, seen from space
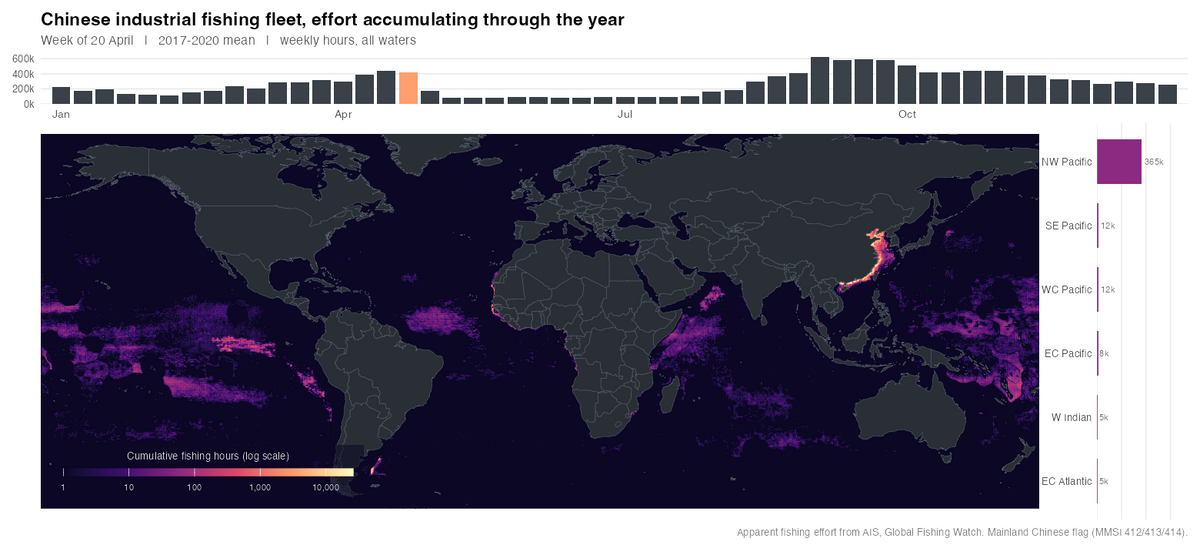
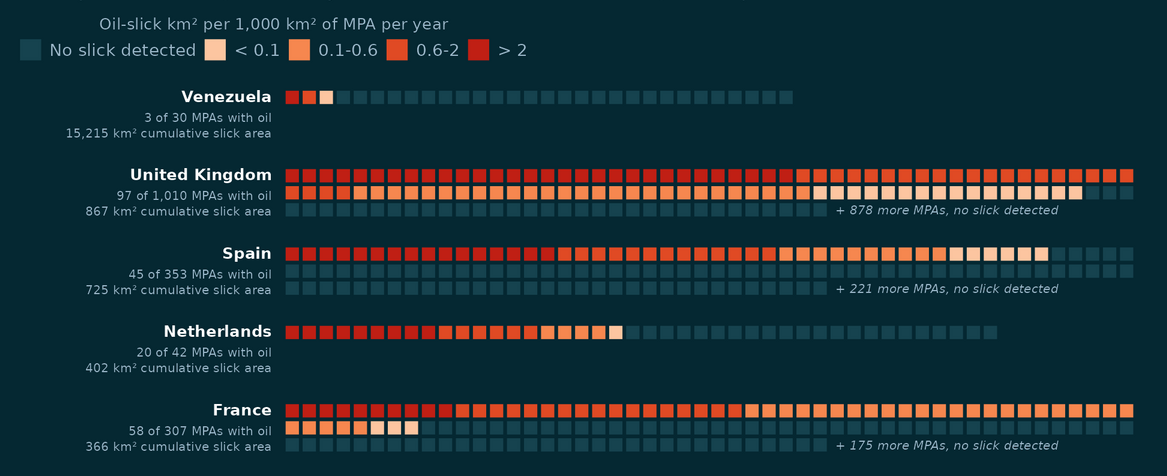
Much of my recent work uses public satellite data to measure human activity at sea: industrial fishing from vessel tracking (AIS) and Sentinel-1 radar, and oil pollution from radar slick detections. These are open, reproducible analyses, each with its code.
- A year of Chinese fleet effort, animated
- Mapping fishing effort beyond AIS: a random forest on paired AIS and radar detections
- How the world's industrial fishing fleets compare, and how much the answer depends on what you divide by
- Oil slicks inside marine protected areas, 2023 to 2025
Global change
Biodiversity change under climate and land use
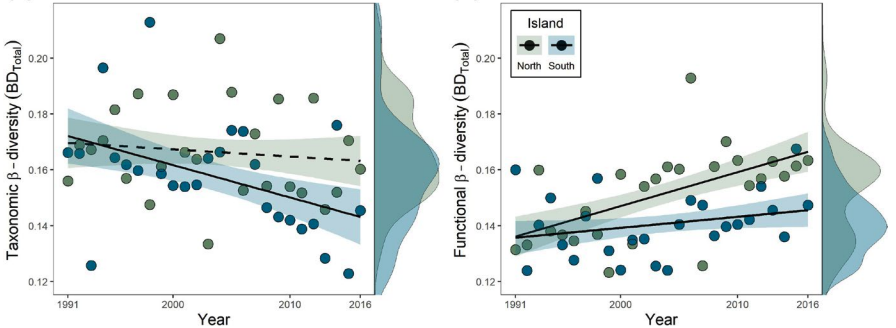
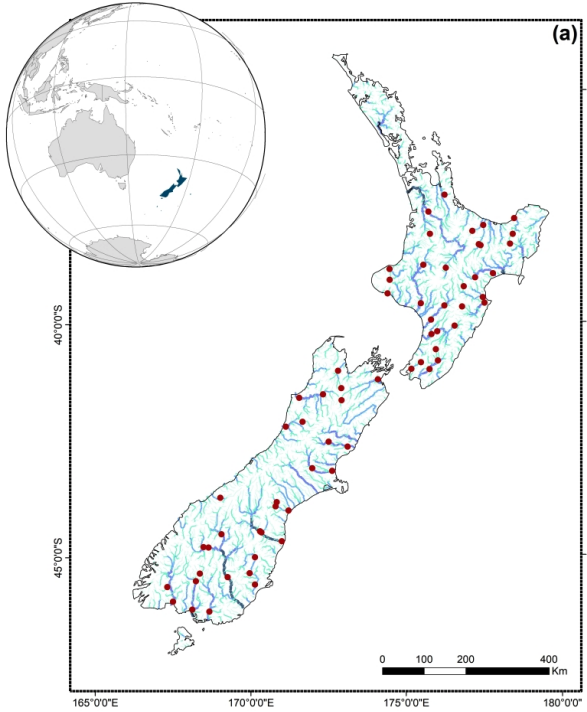
My PhD used three decades of national monitoring data to separate the effects of climate and land use on freshwater communities, showing that species composition and ecological function can respond in opposite directions. Related work tracks how nutrient enrichment reshapes coastal lagoon communities.
- Mouton T.L. et al. Increasing climate-driven taxonomic homogenization but functional differentiation among river macroinvertebrate assemblages. Global Change Biology 2020
- Mouton T.L. et al. Climate and land-use driven reorganisation of structure and function in river macroinvertebrate communities. Ecography 2022
- Mouton T.L. et al. Environmental filtering of native and non-native stream macrophyte assemblages. Science of the Total Environment 2019
- Jones A.G. et al. Disentangling the effects of eutrophication and natural variability on macrobenthic communities across French coastal lagoons. Peer Community Journal 2024
National scale
Mapping and protecting marine life in New Zealand
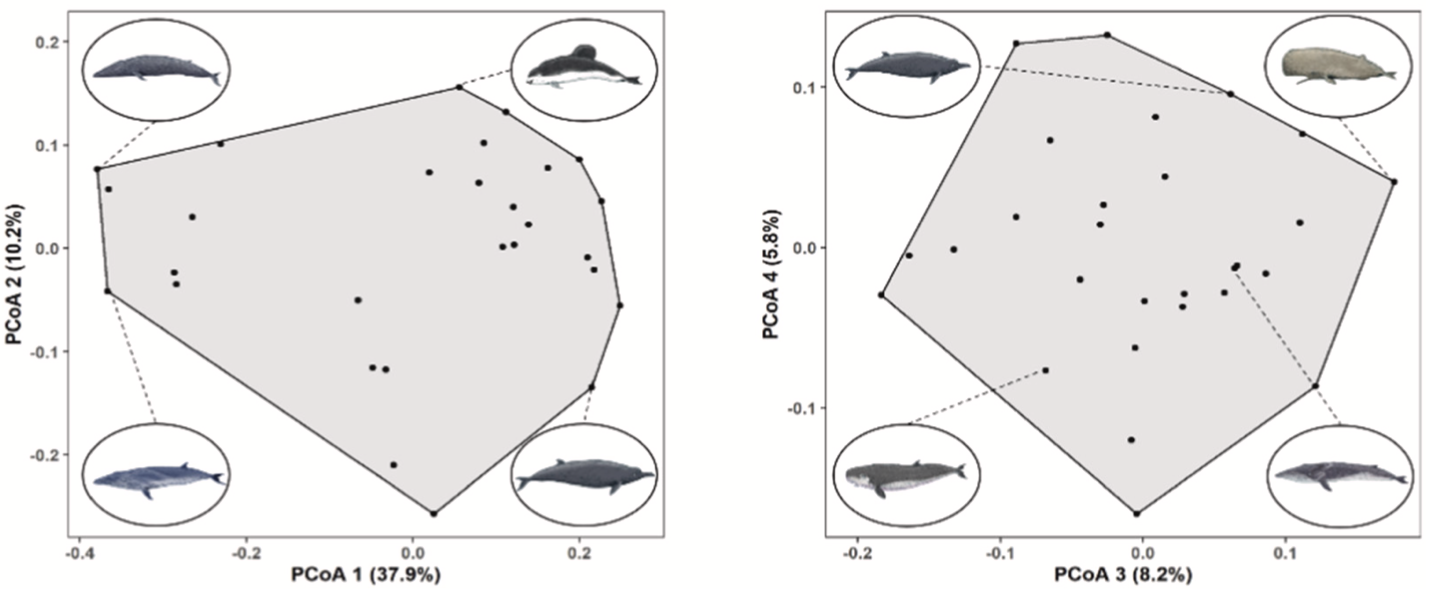
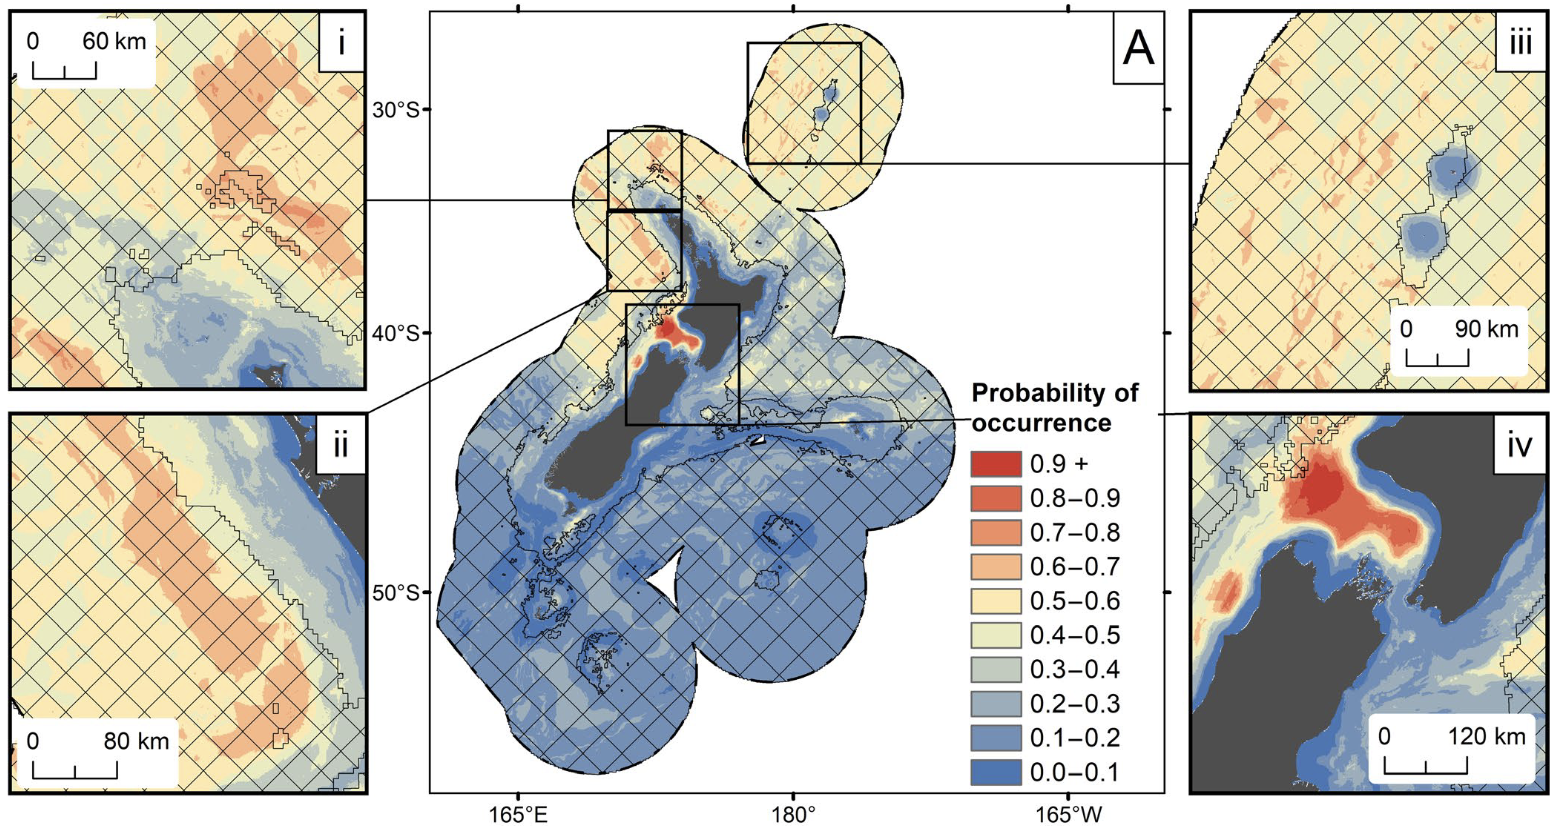
At NIWA I modelled where New Zealand's whales and dolphins live and classified its seafloor communities with machine learning, work that fed conservation planning for Fisheries New Zealand and the Department of Conservation.
- Mouton T.L. et al. Spatial mismatch in diversity facets reveals contrasting protection for New Zealand's cetacean biodiversity. Biological Conservation 2022
- Stephenson F. et al. Modelling the spatial distribution of cetaceans in New Zealand waters. Diversity and Distributions 2020
- Stephenson F. et al. Cetacean conservation planning in a global diversity hotspot. Ecosphere 2021
- Stephenson F. et al. Development of a seafloor community classification for the New Zealand region using a gradient forest approach. Frontiers in Marine Science 2022
